Charting: Adding Value or Voodoo
There is a discussion on LinkedIn about the value of chartists. I thought the following excerpt from my first book (1998) THE ONLY GUIDE TO THE WINNING INVESTMENT STRATEGY YOU’LL EVER NEED: THE WAY SMART MONEY INVESTS TODAY would be of interest.
Technical analysts look at charts of historical prices to find patterns they believe will enable them to identify which direction, and by how much, prices will move in the immediate future. People engaged in this “art” used to be called “chartists.” In order to give them an air of authority and respectability, they are now called “technicians.” If this style of analysis worked, one would be able to see managers who use this style of analysis beating the market. As already shown, no such evidence exists. While this lack of evidence should be sufficient to convince you, there is one dramatic story I believe will convince anyone, except those trying to sell you their technical analysis services.
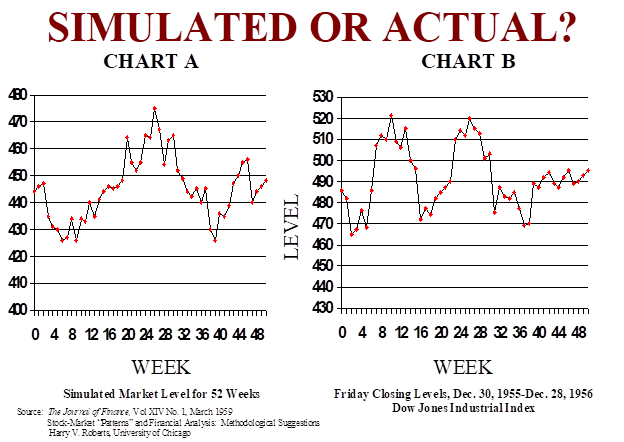
In 1959 Harry Roberts, of the University of Chicago, had a computer generate a series of random numbers that would have a distribution matching the average weekly price change of the average stock (about 2 percent). Since the numbers were randomly generated, there was no pattern and therefore no knowledge that could be obtained by studying a chart of this nature. In order to create the illusion that his charts were those of particular stocks, Roberts placed a starting price of $40 on each chart. He then took a group of these charts to the leading technical analysts of his day. He asked for their advice on whether to buy or sell these unnamed hypothetical stocks. He told them that he did not want them to know the name of the stock since this knowledge might bias them. Each technical analyst had very strong advice on what Roberts should do but since the numbers were randomly generated the patterns were only in the minds of the observers. I am sure that you will never hear about this story from a technical analyst.
Despite the fact that the results of this study were published in the Journal of Finance in 1959, certainly embarrassing the technical analysis “profession,” you can still observe technical analysts dispensing advice on CNBC. And, unfortunately, investors are presumably acting on that advice.28 In actuality, the only thing their advice is good for is entertainment. Taken any other way, it is dangerous to the financial health of the listeners because it causes them to veer from the prudent passive strategy. As a test, see if you can pick out the randomly generated chart from the actual chart of weekly stock prices for 1956. The charts are replicas of ones that appeared in the aforementioned Journal of Finance article. Be sure to cover up the legend at the bottom.
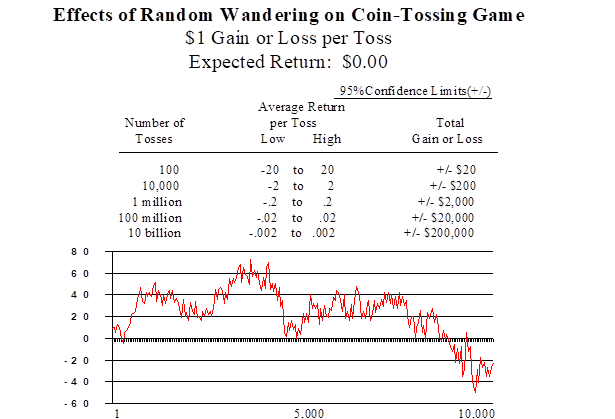
It is worth noting that Roberts’s experiment has been repeated using the results of a computer-generated coin-toss game. As you can see in the following chart, the computer output will produce a randomly generated chart that moves around the expected 50 percent heads and 50 percent tails. It does look suspiciously like the chart of a stock’s price movement. This is, by the way, further support for the EMH. As was just explained, stock prices do move in a random fashion as they respond to new information, which is random in whether it will be better or worse than the markets have anticipated. Technical analysts, if shown this chart, will give you a strong opinion on the future direction of the “stock” the chart is supposedly representing. And George Bush thought that Ronald Reagan was practicing “voodoo economics.”
What I hope you have learned from this story is that while a picture (or chart) may be worth a thousand words, it is not worth even one of your investment dollars.


