
Cracking the Code: A Quantitative Approach to Biotech Investing

Biotech investing has always been treacherous terrain—and for good reason. Of the more than 1,000 biotechs that reached $200 million in market cap over the past 30 years, a staggering 67% lost money. Of these, roughly 50% were acquired at negative total returns, 10% delisted and the remaining 40% are still public with a significant proportion trading below their cash balance representing “zombie biotechs”; failed programs where cash remains stranded instead of being returned to shareholders. Yet the sector has also produced some of the market’s most spectacular winners, turning desperate penny stocks into multi-billion dollar acquisitions.
In a comprehensive new white paper, “Biotech Investing Investment Approaches that Work in a Challenging Industry,” Verdad’s Greg Obenshain, Daniel Rasmussen, and Dr. Anton Wintner tackle a provocative question: Can quantitative methods—typically built on financial statements and traditional value metrics—actually work in a sector where most companies have no revenue, no profits, and binary outcomes that can materialize overnight?
Their answer, backed by over a year of rigorous research, is a resounding yes. But it requires completely reimagining how we think about investment factors.
I’ve covered Verdad’s research extensively over the years, and their work consistently stands out for its methodological rigor and willingness to challenge conventional wisdom. This latest paper is no exception—it represents some of the most innovative thinking I’ve seen in quantitative finance.
What Makes Biotech So Different?
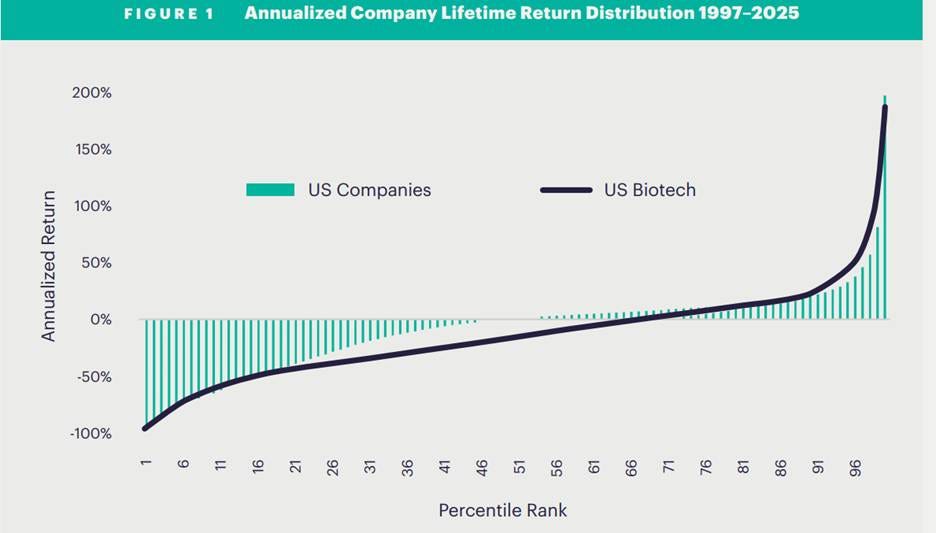
The paper opens with a sobering reality check. The median biotech company delivers an annualized return of -15%, compared to 1% for the median US company. These aren’t companies with struggling business models—they’re science experiments that investors fund in hopes of discovering breakthrough drugs.
Of companies labeled as biotech by Standard & Poor’s, 69% have no revenue, representing a full 57% of pre-revenue companies in the S&P Total Market Index. Companies without revenue and companies without profit are hard to value.
Yet this high failure rate comes with silver linings that make biotech especially attractive for quantitative investors:
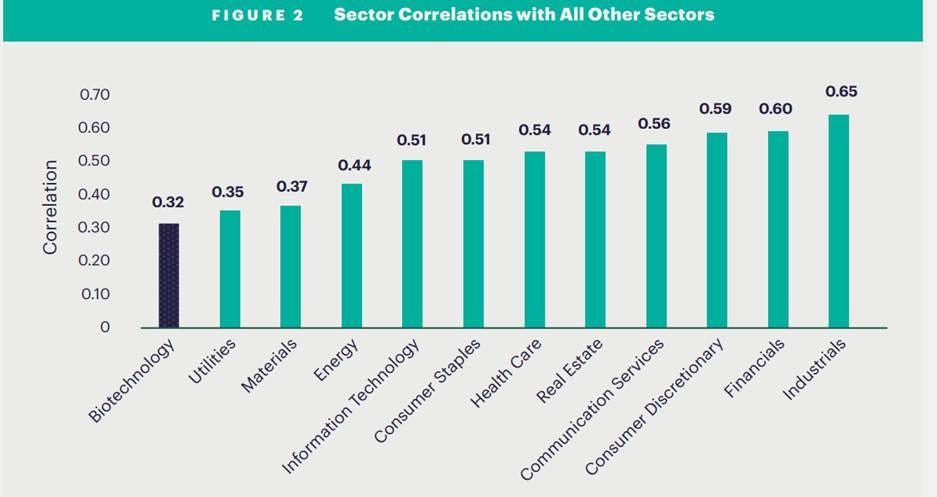
Low correlation: Biotech returns show the lowest correlation with other sectors, making it an excellent diversifier.
Abundance of opportunities: With over 400 companies (11% of the S&P Total Market Index), biotech offers more names to build portfolios than any other sector.
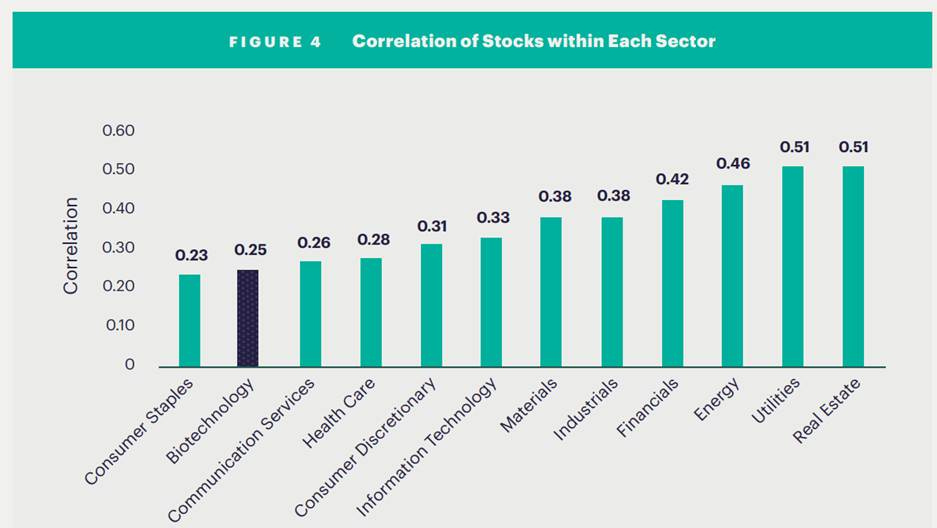
Low internal correlation: Individual biotech stocks are less correlated with each other than stocks in other industries, meaning diversification provides more risk reduction. And quantitative approaches work best when they can benefit from diversification.
The researchers’ first major insight came from studying who invests in biotech successfully: specialist funds, company insiders, and short sellers.
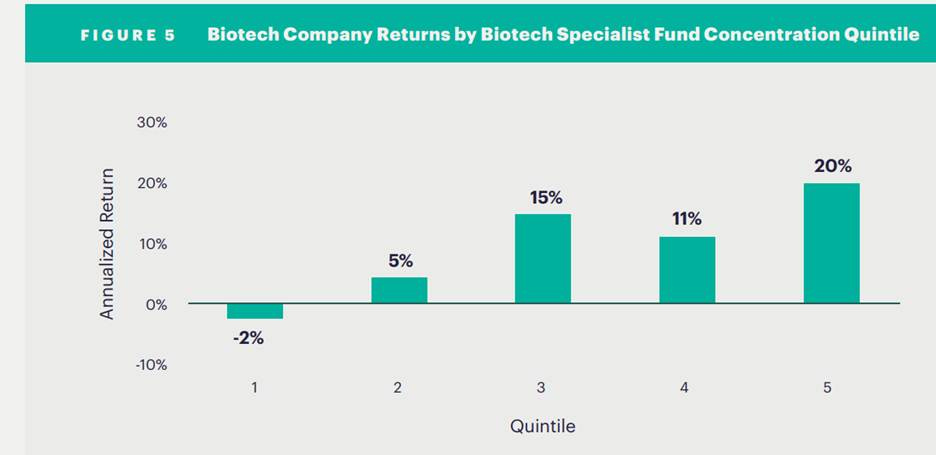
When they sorted biotechs by how heavily specialist funds owned them, a clear pattern emerged. Companies with the highest specialist concentration delivered 20% annualized returns, while those with no specialist ownership returned lost 2% per annum. The story of Pharmacyclics, recounted in For Blood and Money: Billionaires, Biotech and the Quest for a Blockbuster Drug, exemplifies this perfectly—specialist funds like OrbiMed and Baker Brothers identified its potential when it traded at $1.28, years before its eventual $21 billion acquisition at $261.25 per share.
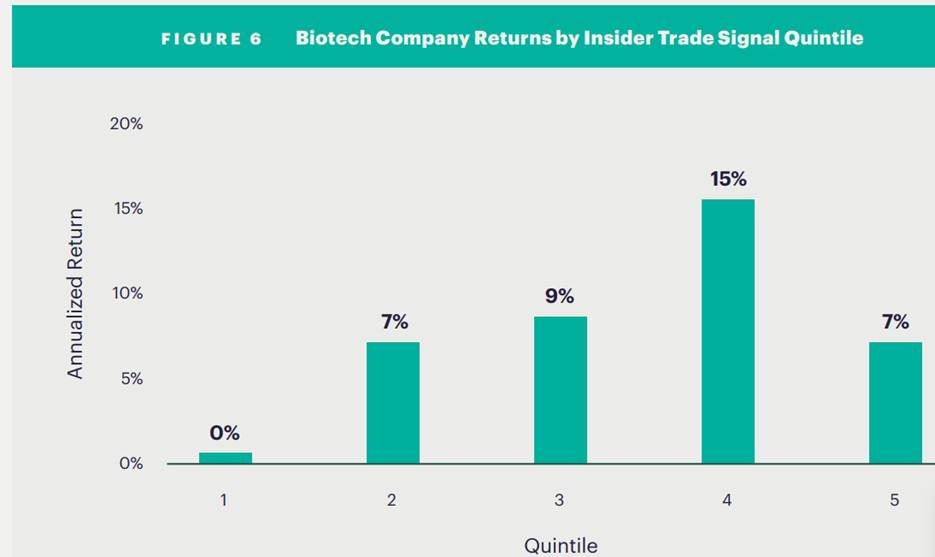
Company insiders proved equally prescient. High-signal insider buying correlated with 20% returns, while bearish insider activity predicted 0% returns.
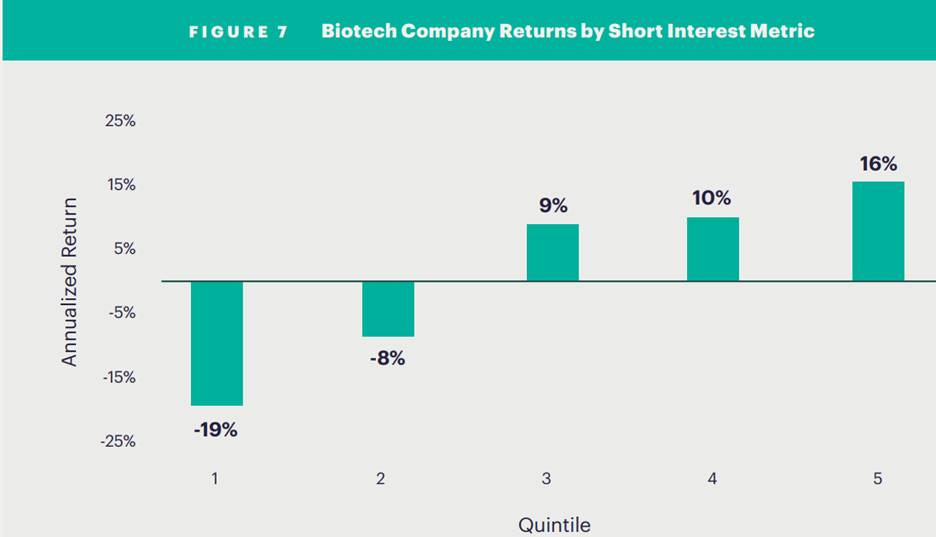
Short sellers also turned out to be excellent at identifying losers—heavily shorted stocks returned -19% while minimally shorted stocks returned 25%.
Key insight: Expertise matters enormously in biotech, and these expert signals are measurable and actionable through public data like 13-F filings and insider transaction reports.
Building the Clinical Trial Database
Most industries run on financial statements. Biotech runs on clinical trials. Each trial readout is a binary moment where stocks can double or collapse overnight. The authors recognized that any serious quantitative approach must begin with clinical trial data.
So Verdad spent more than a year creating a point-in-time dataset covering over 130,000 clinical trials, drawing from registries, SEC filings, company documents, and government sources. The data set allowed them to quantitatively compare individual trials and track how company research programs evolved over time. This required tracing drug candidates through name changes, partnerships, mergers, and spin-outs to reconstruct the lineage of every research program.
This database enabled them to calculate scientific peer groups—companies working on similar diseases, at similar clinical stages, or pursuing parallel therapeutic approaches. These peer groups unlocked new ways to measure momentum and value in biotech.
Rebuilding Factor Models for Biotech
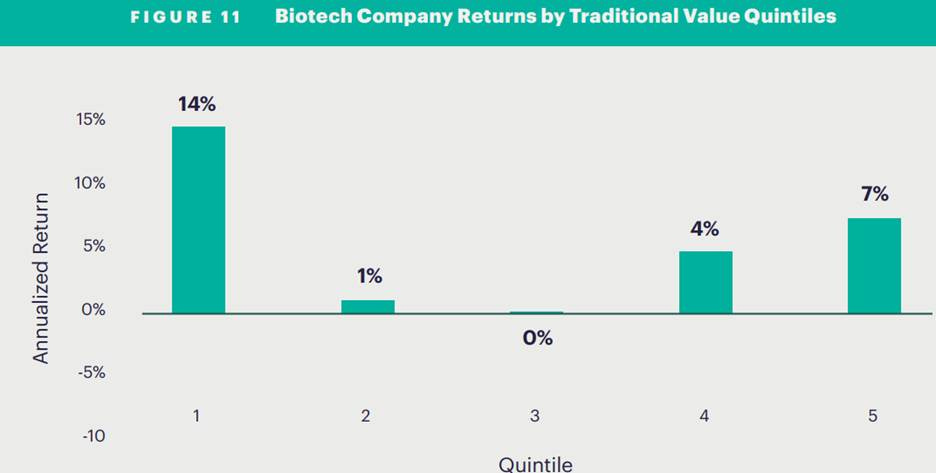
Traditional quantitative factors simply don’t work in biotech. When the researchers applied standard value metrics (based on profits), expensive stocks actually outperformed cheap ones—the opposite of what should happen. Traditional momentum showed no predictive power whatsoever.
The breakthrough came from biotech-specific definitions:
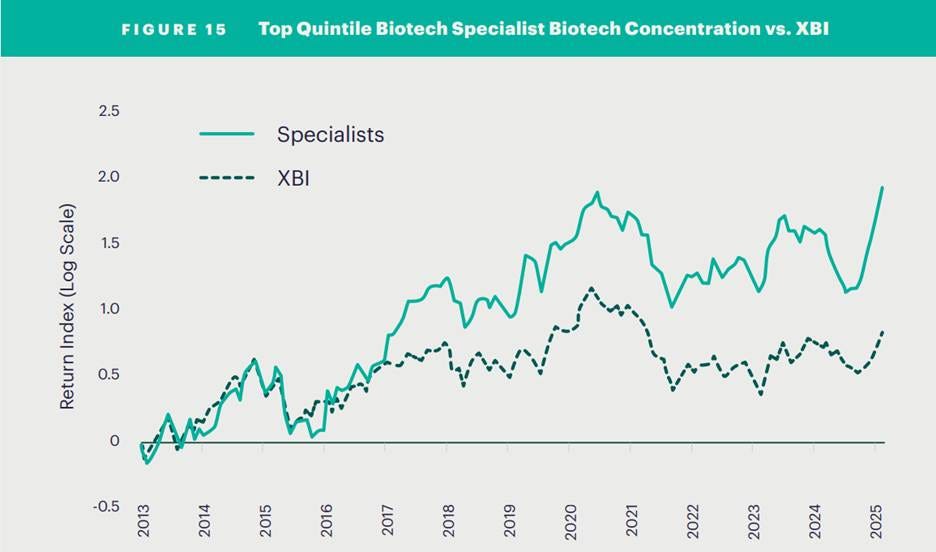
1. Quality = Specialist Consensus: Rather than measuring quality through gross profits (which don’t exist), the authors use the collective judgment of biotech specialists, insiders, and short sellers as a proxy for company quality. There has been a very clear return advantage by following the specialists. The following chart compares the returns of the top quartile specialists with the returns of the State Street SPDR S&P Biotech ETF (XBI)—although there was no reduction in risk as measured by either max drawdown or volatility.
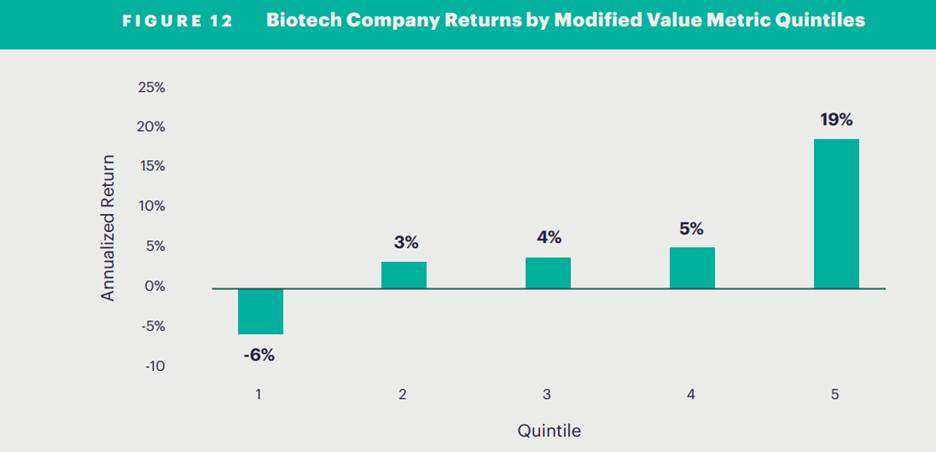
2. Value = Spending-Based Metrics: Instead of anchoring value to profits, they anchor it to spending. Since clinical trials are expensive and not undertaken lightly, total spending provides a meaningful measure of a company’s research commitment. Companies that are cheap relative to their spending levels and peer companies tend to outperform.
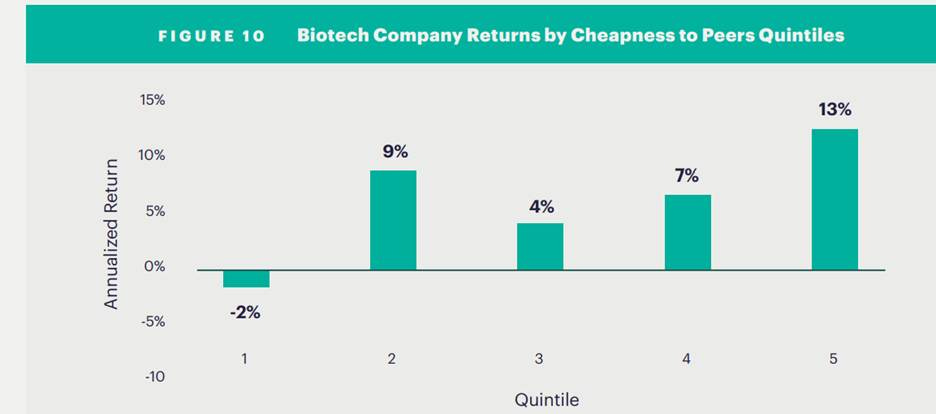
3. Relative Valuation to Peers: Instead of measuring if a biotech stock is cheap or expensive relative to the market, measure valuation relative to its peers.
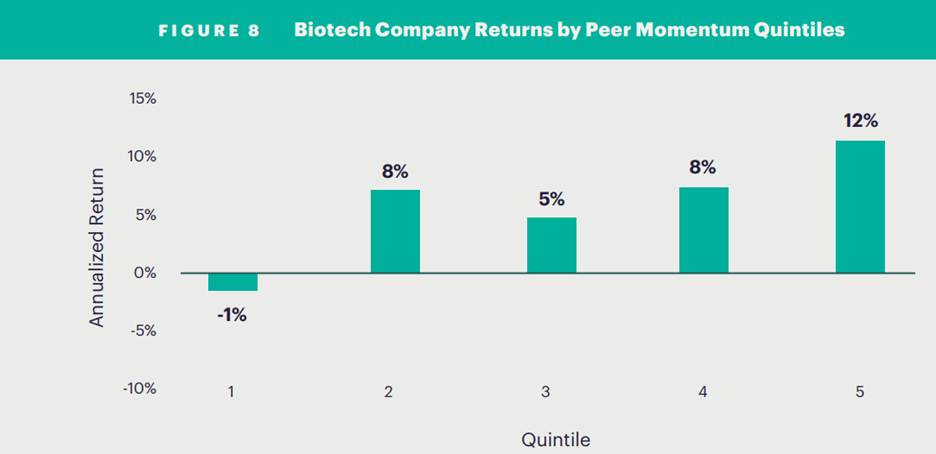
4. Momentum = Peer Performance: Traditional momentum (a stock’s own trailing returns) doesn’t work in biotech. But peer momentum—how a company’s scientific peers have performed—spreads returns effectively. Stocks whose peers returned strongly delivered 15% annualized returns versus -1% for those whose peers underperformed.
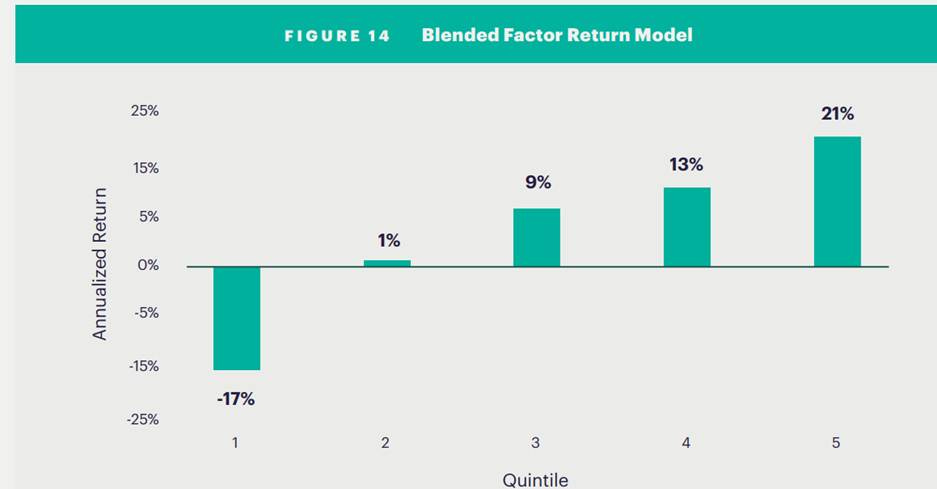
When combined, these three factors create a model that spreads returns from -17% for the worst quintile to 25% for the best quintile—a remarkable 42 percentage point spread.
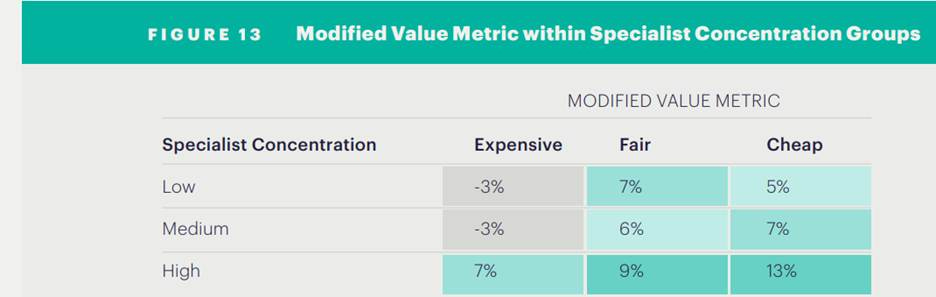
5. Combining valuation and quality (specialist consensus): Measuring them independently reveals that the modified value metric still spreads returns—the best performing stocks are those that are favored by specialists and are cheap, while the worst performing stocks are the ones that are spurned by specialists and are expensive.
6. Blended three-factor model, value, quality and momentum, for biotech: A blended model outperforms any single factor, and—most importantly—uncovers opportunities not only to go long the strong but to short the weak.
The Power of Long-Short
Perhaps the paper’s most important insight is about risk management. Following specialist funds long-only generates solid returns (20% annualized), but with high volatility—a 61% maximum drawdown and 29% annual standard deviation. The returns are also 82% correlated with the biotech benchmark, providing little diversification benefit.
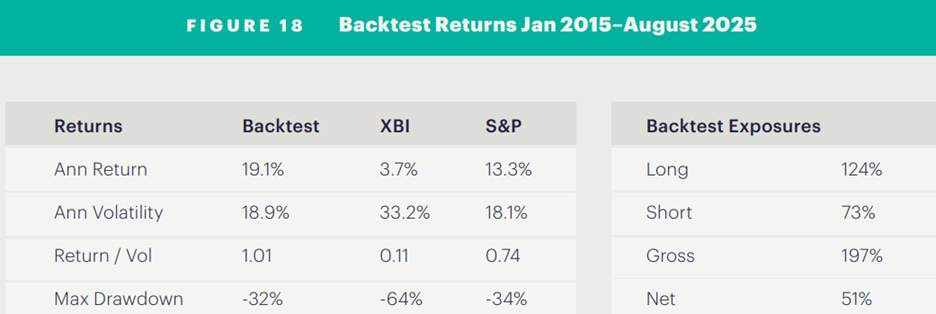
The solution: systematic shorting. Biotech’s high failure rate means there are many reliably bad companies to short. By constructing a disciplined long-short portfolio using their factor model, the researchers achieved:
19.1% annualized returns (net of all costs)
18.9% volatility (less than two-thirds the volatility of long-only)
-32% maximum drawdown (half the long-only drawdown)
Smooth, consistent returns through multiple market cycles
The backtest accounts for realistic constraints: trading costs, market impact, short borrow costs, and availability. This isn’t theoretical—it’s implementable.
Why Now?
The paper concludes with a compelling case for timing. Since December 2019, the S&P Biotech Index has returned just 4.5% annually while the S&P 500 gained 15.1%. The sector remains down 21% from its 2021 peak.
But history suggests this creates opportunity. When biotech has experienced similar relative drawdowns in the past (1989, 1995, 2007, 2011), subsequent two-year returns averaged 63%. What makes the current setup particularly compelling is the convergence of technical positioning with fundamental catalysts.
Three fundamental catalysts support a biotech recovery:
The patent cliff: $200 billion in annual drug revenues face patent expiration by 2030, forcing large pharma to acquire new assets
Innovation surge: 2024 and 2025 each saw 46+ new drug approvals, with 72% developed by small and midsize companies
AI integration: Artificial intelligence is reducing development timelines by 6-12 months, adding $200-400 million in NPV per portfolio
The combination of depressed valuations, negative sentiment, and strong fundamental drivers historically creates the conditions for sector outperformance. While timing any market turn is uncertain, the risk-reward appears asymmetrically favorable for investors with appropriate diversification and risk management.
Key investor Takeaways
Keep reading with a 7-day free trial
Subscribe to Larry’s Substack to keep reading this post and get 7 days of free access to the full post archives.