


Second Quarter 2025 Economic and Market Review and Outlook

Israel’s June 12th attack on Iran’s nuclear and military facilities increased geopolitical risks (raising the risk of a broadening of the conflict across the region), pushed energy prices higher (and could have led to them going much higher, for example, if Iran had blocked the straits of Hormuz) with a negative impact on inflation, impacting the Fed’s ability/willingness to lower interest rates in response to weaker economic growth. While sharp increases in oil prices have been major factors in four prior recessions (1973, 1980, 1982, and 1990) Columbia University’s Center on Global Energy Policy noted that while in 1973 one barrel of oil was responsible for $1,000 of gross domestic product, it’s now less than half that. In addition, unlike in 1973 when the US was a large net importer of energy, today we are a net exporter. According to the Fed’s FRBUS model of the US economy, a sustained $10 increase in oil prices would be expected to increase inflation by 0.4% and lower GDP by 0.4%. With that said we turn to our review.
Fortunately, a cease fire was reached between Israel and Iran shortly after the US attacks on the Iranian nuclear facilities. That has at least temporarily reduced the geopolitical risks, and a barrel of Brent Crude oil fell back below $67 at the end of the quarter. We turn now to our economic and market review.
The first quarter of 2025 saw US GDP decline by 0.2%. A major factor in the slowdown was a frontloading of imports to get ahead of expected increases in tariffs (imports subtract from GDP while exports add to GDP). Despite the decline in the first quarter GDP, the economy continues to add more than 100,000 jobs per month (about the rate needed to prevent unemployment from rising). And, the Atlanta Federal Reserve Bank’s model projects a robust 4.6% GDP growth for the second quarter (helped by a reversal of the growth of imports). Despite this, the broader outlook for the US economy has deteriorated compared to three months ago. According to the Philadelphia Federal Reserve’s Second Quarter Survey of 36 professional forecasters (the “wisdom of crowds”), real GDP is now expected to grow by just 1.4% in 2025 and 1.6% in 2026—down 1.0 and 0.5 percentage points, respectively, from prior estimates. Inflation expectations have also risen, with 2025’s estimate increasing from 2.5% to 3.3%.
While the economy has avoided the recession many had forecasted, the outlook on both the growth and inflation fronts has dimmed, and the risk of a recession has increased. The following chart from the Philly Fed’s second quarter survey shows the mean probabilities of a recession in 2025.

The following are “baker’s dozen” of key economic and market risks currently weighing on consumers, corporations, and investors.
1. The Ongoing Negative Impact of Tariffs on Earnings, Inflation, and GDP
Tariff hikes are typically stagflationary shocks, simultaneously increasing the probability of an economic slowdown while putting upward pressure on prices as they not only increase the cost of imported goods but also allow US producers to raise prices. The originally announced tariff plans were broader and more aggressive than anticipated, reminiscent of the 1930s Smoot-Hawley levels which were around 20%. With nearly 40% of imports from China being intermediate goods, tariffs raise production costs for US companies, and reduce competition from cheaper imports, further stoking inflation. Small businesses—responsible for over 80% of US employment and capital expenditures—are especially vulnerable, as tariffs must be paid upfront. Tariffs also negatively impact productivity because they skew activity toward more production in less efficient, protected markets. Lower productivity means lower economic growth. And the dramatic fall in illegal border crossings and the increase in deportations also has negative impact on the GDP.
The relatively good news is that it now seems likely that the tariffs that will take effect on July 9, will not be as high as the market had originally thought possible (an average rate of about 16%) That has helped the equity markets recover all of the losses they experienced when the original tariff plans were announced. Further good news is that Canada has rescinded its 3% Digital Services Tax (DST) on large internet and technology companies in order to restart and advance broader trade negotiations with the US.
Given the uncertainty about what the final tariffs will be, it’s hard to know what the impact will be. We do know that the effect from tariffs (which is a tax) is that they create a fiscal drag, on the order of 0.5% of GDP. That fiscal drag would have a negative impact on GDP growth of about 1% in 2026.
2. Trade Deal Uncertainty and Trade War Retaliation Risk
· Uncertainty surrounding trade significantly hampers economic growth by deterring crucial business decisions. When the future of tariffs, trade agreements, and international relations remains unclear, companies become hesitant to make long-term investments in areas like capital expenditures, hiring, and supply chain commitments. This "wait-and-see" approach reduces overall business confidence, leading to delayed expansion plans and a potential slowdown in production. Moreover, uncertainty can disrupt global supply chains, increase the cost of imports due to potential tariffs, and make financial planning more difficult for businesses. This ripple effect translates into slower GDP growth, higher prices for consumers, and a dampening of overall economic activity as both businesses and households pull back on spending and investment.
· Increased uncertainty could lead to an increase in the equity risk premium required by investors, causing a fall in equity prices. Due to the wealth effect, a fall in stock prices would lead to lower consumer spending and, thus, a slowing of the economy.
· Credit spreads could widen due to increased uncertainty and heightened risk of recession. That would lead to lower corporate spending and lower levels of M&A activity.
· Foreign spending on US tourism could decline sharply in retaliation for the tariff war. Tourism makes up 10% of the GDP. Thus, any slowdown in tourism is going to be bad for the economic outlook. The tourism industry projects a $12.5 billion drop in spending by international visitors in 2025, from $181 billion last year to less than $169 billion this year.
· Foreign governments could further reduce their holdings of US dollars as reserves (in retaliation for tariff increases, fear of confiscation as is the case with Russia, and also for geopolitical reasons), putting upward pressure on US interest rates—which would be drag on economic activity and put further pressure on the budget deficit and the dollar. According to an OECD report, sovereign debt in developed countries will reach nearly $59 trillion this year. Central banks will own about $11 trillion of that, down from $15 trillion four years ago. That means other investors have to fill the gap and also soak up massive issuance

3. Extreme Uncertainty for Business Planning and Weak Corporate Confidence
· Surveys of CEOs and CFOs show that corporate confidence has declined in recent months. Reduced confidence leads to reduced hiring and lower CAPEX spending.

The chart below shows CEOS are worried about geopolitical uncertainty, tariffs and regulatory uncertainty.
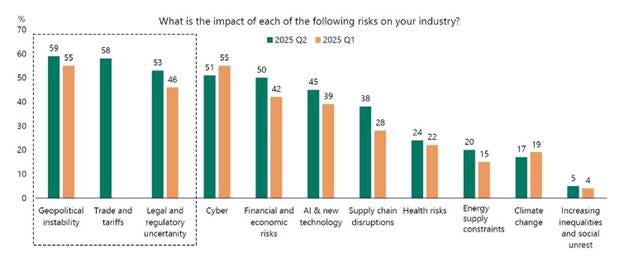
· There could be a negative hit to corporate earnings as spending falls and companies likely will have to absorb some of the costs of the tariffs resulting in smaller margins. Note that about 50% of the Mag 7 earnings are international, with the figure being about 40% for the S&P 500.

4. Historically Weak Consumer Confidence
· Consumer confidence has fallen, which likely will lead to slowing of consumer spending which makes up almost 70% of the US GDP.

5. Consumer Spending Slowing Because of Higher Prices in Stores Such as Walmart
Price increases at major retailers like Walmart signal broad inflationary pressures, prompting consumers—especially those living paycheck-to-paycheck—to cut back on discretionary purchases, dampening economic growth.
6. Student Loan Repayments Starting
The restart of student loan payments is reducing disposable income for millions, leading to cutbacks in spending across sectors and increasing the risk of delinquencies in other forms of debt.
7. Housing Demand Weakening Due to Higher Rates
For the last two-and-a-half years, mortgage applications to purchase a home have been wobbling along above the record lows of November 2023 and February 2024 in the data going back to 1995.

Mortgage rates near 7% have cooled housing demand, with home sales in April at their slowest pace since 2009. And contract signings are down, suggesting further weakness in coming months. May’s sales were slightly better (+0.8%).
8. DOGE Laying Off Government Workers
In a report released on May 1, executive outplacement firm Challenger, Gray & Christmas said the government had led all U.S. sectors in job cuts this year with 282,227, of which 281,452 were attributed to DOGE-related cost-cutting. Those cuts also lead to downstream effects on the economy as it is estimated that each government job supports 2-3 private jobs (such as day care and restaurants). In addition, millions of private sector jobs are tied to federal contracts (such as with consulting firms) and grants. DOGE’s efforts could lead to a sharp reduction in spending, leading to rising unemployment.
9. Moody’s Downgrade Increases Borrowing Costs for US Consumers and Businesses
Concerns about the loss of US government credibility and reliability due to the rising US debt burden could jeopardize US Treasuries as a safe-haven asset, potentially reducing demand for Treasuries, raising the cost of debt (dampening spending investment while increasing the federal deficit) while also putting downward pressure on the US dollar. The deteriorating situation—increased federal spending and reduced revenues from tax cuts—led Moody’s to drop the credit rating of US Treasuries on May 16th to below the coveted AAA level. All three major rating agencies have now lowered their ratings for U.S. debt. The US sovereign CDS spread is currently trading at levels similar to countries that are rated BBB+, such as Italy and Greece, see chart below.

Unfortunately, the downgrades, which reflect the fact that the US is on an unsustainable fiscal path, do not yet appear to have attracted the attention of policy makers. Perhaps it will take a boycott by “bond vigilantes” to cause action to be taken. Should that occur it would be negative for stocks, bonds, and the economy.
With that said, the huge budget deficits, and the funding requirements they lead to, are leading to a “crowding out” of private debt. Over the past year, roughly half of all fixed income product coming to the market has been Treasuries.

The result is that more dollars are going to finance the government rather than financing growth in the economy through loans.
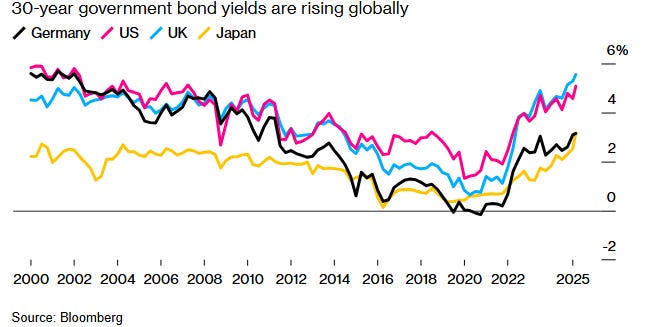
10. Sovereign Yields Rising Around the Globe
Around the world, yields on longer-dated sovereign debt have risen as investors question the ability of governments to cover massive budget deficits. Just as low international interest rates helped to lower US rates (as foreign investors bought higher yielding US debt), higher international rates, combined with concern over the US dollar, could lead to the reverse effect as international investors convert dollar holdings to local currency holdings.
11. The Rise of Cryptocurrencies
The increase in value of cryptocurrencies means that there is lessened demand for dollars in the global economy, potentially pushing up US interest rates.
12. Section 899 of the One Big Beautiful Bill Act
One of the provisions of the bill the senate was considering was one that would have given the Treasury secretary the power to levy retaliatory taxes on the US investments of foreign countries that have levied “unfair taxes” on US companies. Treasury would have to tell Congress each quarter which countries apply “extraterritorial and discriminatory” taxes (i.e., the EU’s digital services tax) and can then levy a 5% tax surcharge on their investments in the US, which could rise in stages to 20%. Financially, the chief effects would be to weaken the dollar, a key administration aim, and to help foreign markets outperform the US.
The good news is that on June 26th, the Treasury Department announced a deal with G-7 allies to exclude US companies from some taxes imposed by other countries in exchange for removing the Section 899 "revenge tax" proposal from President Donald Trump's tax bill. The deal means that OECD Pillar 2 taxes (a global initiative designed to ensure that large multinational enterprises pay a minimum level of tax—specifically, an effective tax rate of at least 15%—on the income they earn in every country where they operate) will not apply to US companies. This removes one of the risks as the proposal the proposal would have made it much harder for foreign individuals and companies to invest in the US.
13. Falling Dollar
Over the last 30 years, the dollar and relative US stock performance have moved almost exactly in line with each other, with the dollar (on a real or nominal basis) gaining as US stocks outperformed. That trend reversed in 2025, providing a tail wind for international equities.

Despite this year’s decline, the US dollar remains notably overvalued by traditional measures. Purchasing Power Parity (PPP) models estimate the dollar is still about 15% above its fair value as of early 2025.
IMF data shows the US dollar even more overweighted. Against key developed markets, the US dollar 2023 overvaluation was 21%. But for leading EM nations it was 109%, driven by their need to maintain trade competitiveness.

Another risk for the dollar is that the consensus expects inflation to rise in the US and fall in the eurozone (see chart below). This divergence in inflation increases the likelihood of continued dollar weakness.
Structural and Cyclical Drivers
Much of the dollar’s persistent overvaluation is structural, rooted in its status as the world’s primary reserve currency. This has created ongoing demand for dollars, keeping its value elevated even when fundamentals (such as purchasing power parity) would suggest otherwise. However, this reserve status is now facing new challenges: rising US deficits, policy uncertainty, and growing efforts by central banks to diversify their reserves, are all contributing to a reassessment of the dollar’s role in the global system.
History shows that the dollar moves in multi-year cycles, with periods of strength followed by prolonged declines. Since the 1970s, these cycles have averaged about 7–8 years each. See chart below.

What a Dollar Decline Could Mean for Global Equities
Historically, a weaker dollar has been a tailwind for international equities. When the dollar depreciates, foreign earnings translate into higher returns for US-based investors, and capital tends to flow into non-US markets. When the dollar has been extremely overvalued on the IMF’s PPP data, the Fed’s trade-weighted index has tended to decline over the next five years at an average pace of 4.5% per year. Should that occur it would provide a tailwind to foreign equities.
Recent market behavior underscores this point: as the dollar weakened in early 2025, European equities saw their strongest foreign inflows in a decade, and emerging market assets began to outperform. If the current cycle continues, investors with diversified global portfolios may be well-positioned to benefit from this shift.
Conclusion
The US dollar remains historically overvalued, even after its recent reversal. Structural factors, cyclical trends, and shifting macroeconomic risks all point toward the potential for the risk of further declines in the coming years.
Bottom Line: Risk of US Economic Recession Has Increased
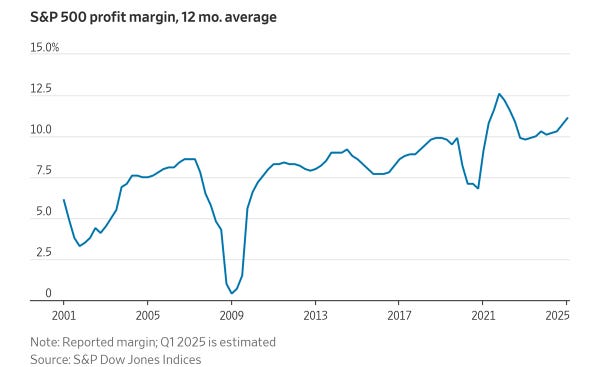
The probability of a US recession has increased. Historically, recessions have resulted in an average GDP decline of 2.3% and an 11% drop in S&P 500 earnings. Tariffs and other self-inflicted policy risks could further erode profit margins particularly for large growth stocks that have benefited from elevated valuations. Margins for the S&P 500 averaged 7.8% between 2000 and 2015, excluding recessions, and last year they were 10.7%.
It is important to note that this economic turbulence differs from previous downturns, which were triggered by external shocks such as terrorism (2001), financial leverage (2008), or the COVID-19 pandemic (2020). Today’s risks are largely policy-driven and, thus, in theory, reversible.
The “Big Beautiful Bill” Could Limit the Fed’s Ability to Fight Recession
If approved by the US Senate and signed by Trump, the impact of the “Big Beautiful Bill” would be stimulative in the short run (via tax cuts) but could keep further upward pressure on rates and, therefore, the cost of servicing the US debt in the long run. In addition, if a recession were to occur, it would likely widen the budget deficit, already a concern for markets, and could limit the Federal Reserve’s ability to respond effectively.
Having reviewed the potential risks it is important to note that there are some potential offsets.
Potential Offsets
Tax cuts to stimulate capital investment and a friendlier regulatory environment could boost productivity and employment, helping to offset inflationary pressures. Pro- growth policies can also help stabilize the debt-to-GDP ratio. A recent study found that If productivity growth was 0.5 percentage point per year faster than CBO expects throughout the next three decades, then the ratio of debt-to-GDP would be stabilized.
Corporate and consumer balance sheets remain generally healthy, with many having locked in lower rates. The banking sector is also well-capitalized, with Tier 1 equity at major banks reaching record highs— capital at 20 of the largest US banks grew by more than $175 billion in the past three years bringing Tier 1 common equity to almost $1.3 trillion.
Even with these positives, a concern is that US equity valuations remain above historical averages, even as risks mount. Given all the risks it would seem logical that the equity risk premium that investors would require would be relatively high. Yet US equity valuations remain well above historical averages. The S&P‘s current forward 12-month PE is 22, well above its 10-year average of 18.6. With stocks trading at 22 times earnings in the next 12 months, the S&P 500’s valuation is well above its 10-year average of 18.6.

And the current Shiller CAPE 10 is about 38.

A Note on Equity Returns in 2025: What You Don’t Know About Investing is the Investment History You Don’t Know
While the S&P 500 ended the second quarter up almost 6%, it got off to a rough start in 2025. Vanguard’s S&P 500 ETF (VOO) closed 2024 at 536.95. It hit a closing low on April 8 of 456.74, a drawdown of about 15%. Unfortunately, losses like that cause many investors to lose discipline and abandon even well-thought-out plans. Knowledge of financial history might help them avoid that mistake. The chart below shows that most years that experience large declines during the year end up with positive results. Despite average intra-year drops of 14.1%, annual returns were positive in 34 of 45 years.

Investor Takeaways
While the US economy looks to be on stable ground (unemployment and new claims for unemployment remain relatively low), there are risks that investors should not ignore.
· Elevated and increasing fiscal deficits (not just in the US but in most of the developed world) can crowd out private investments, negatively impacting growth.
· Geopolitical tensions (the Middle East, Ukraine, Taiwan) which can lead to rising commodity and energy prices from global disruptions.
· The risk of rising wages if the labor market tightens due to reduced immigration and increased deportation leading to a rekindling inflation.
· Increased tariffs and US economic nationalism (which can easily become outright protectionism, leading to global trade wars).
· The potential for a successful cyberattack on our financial system or our infrastructure.
· While the markets are still anticipating further interest rate cuts by the Fed, there is the risk that sticky inflation could cause the Fed to pause even if the economy continues to slow—while globalization of supply chains helped to keep good inflation low over the past 30 years, deglobalization could provide upward pressure on goods inflation.
When constructing portfolios investors should be sure to not make the mistake of treating even the unlikely as impossible, and what they think of as likely, as certain. Given the still high level of valuations of US equities (mainly large cap growth stocks), the markets appear to have priced in a very low probability of any of these risks appearing.
Hedging versus Diversifying
Prudent investors know that they should hedge (buy insurance) the known risks (like buying life, disability, car and homeowner’s insurance) and diversify against the unknown (or highly uncertain) risks. Adding assets (such as reinsurance and long-short factor funds) with low to no correlation with economic cycle risks helps to reduce portfolio tail risk and that reduces sequence risk for retirees. In addition, the continuation of high fiscal deficits creates the risk of more volatility in inflation. Another risk to inflation is the transition to a greener economy—by shifting away from cheaper methods of production and consumption that are less environmentally friendly. Thus, investors exposed to this risk should consider holding more assets (such as floating rate debt, TIPS, gold, commodities, and real assets such as real estate and infrastructure) that typically benefit from higher inflation.
Advisors and Investors should be prepared for volatility, especially if Congress is unable to avoid a shutdown of the government or a default on our debt (if the debt ceiling is not raised), trade tensions increase, geopolitical risks increase, or we have a financial accident. One way to address the risks, making the portfolio more resilient to “Black Swan” type events, is to diversify exposure to risk assets to include other unique sources of risk that have historically had low to no correlation with the economic cycle risk of stocks and/or the inflation risk of traditional bonds but have also provided risk premiums. The following are alternative assets that may provide diversification benefits. Alternative funds carry their own risks; therefore, investors should consult with their financial advisors about their own circumstances prior to making any adjustments to their portfolio.
· Reinsurance: The asset class looks attractive, as losses in recent years have led to dramatic increases in premiums, and terms (such as increasing deductibles and tougher underwriting standards) have become more favorable. Those changes led to returns being well above historical averages in 2023 and 2024. Investors can consider such funds SRRIX, SHRIX, XILSX and CBYYX.
· Private middle market lending (specifically senior, secured, sponsored, corporate debt): This asset class also looks attractive, credit spreads have widened, lender terms have been enhanced (upfront fees have gone up), and credit standards have tightened (stronger covenants). Investors can consider such funds as CCLFX, CELFX, and FRBBX.
· Long-short factor funds. Investors can consider such funds as QRPRX and QSPRX.
· Commodities. Investors can consider such funds as DCMSX.
· Trend following (time-series momentum): It tends to perform best when needed most, during extended bear markets. Investors can consider funds such as AQMIX.
(Disclosure: I am currently personally invested in SRRIX, XILSX, CBYYX, CCLFX, CELFX, FRBBX, QRPRX, and QSPRX.)
Finally, here is an interesting chart from Apollo showing that private equity and private credit have outperformed the S&P 500 over horizons out to 10 years.

Cautionary warning
My 50 plus years of experience has taught me that one of the biggest and most common mistakes investors make is that they focus on forecasting the future (which is not only unknowable, but also likely filled with future unpredictable large drawdowns), instead of focusing on managing risks. That is why my reviews of the market and economy focus on risks, not specific forecasts. This tendency is a major failure for two reasons. First, investors are on average highly risk averse. Second, stock returns are not even close to being normally distributed, with large losses occurring with much greater frequency than if the distribution of returns was normally distributed. The conclusion investors should draw is that their focus should be on minimizing the risks of large losses, making their portfolios more resilient to “black swan” events—or as Nassim Nicholas Taleb recommends, building portfolios that are “antifragile.” To do that you need to include a significant allocation to assets whose risks are not highly correlated with the economic and geopolitical risks of equities and the inflation and credit risks of bonds.
Larry Swedroe is the author or co-author of 18 books on investing, including his latest, Enrich Your Future: The Keys to Successful Investing. He is also a consultant to RIAs, educating them on investment strategies.
Thanks Rich, stand corrected
Good write up, but. Yes, there is a but. Imports don’t subtract from GDP, they are neutral. Imports are included in C and I and are subtracted from X. Timing differences will creep in, but on balance, M’s contribution is neutral.