


The Long-Run Performance of US Public Pension Funds

The long-term performance of US public pension funds remains a subject of vigorous debate, particularly regarding the value added by alternative investments such as private equity, real estate, hedge funds, and private debt. Recent research by Richard Ennis brought renewed attention to the impact of these alternative allocations on pension fund returns.
Richard Ennis, author of the study “The Long-Run Performance of Public Pension Funds in the United States,” published in the June 2025 issue of The Journal of Investing, compared the performance of public pension funds with a market index that he designed with a specific stock-bond mix to mimic funds’ risk profile. For example, a key reason why private equity public market equivalents (PMEs) often show up as 1.2x is because private equity is being compared to large cap equities. However, their PMEs decline to 1.0x after adjusting for private equity’s small size and value characteristics. This is an important point for investors to consider when comparing returns. Using regression analysis of returns from a database of 54 funds sponsored by the Center for Retirement Research at Boston College, Ennis found that over the July 2001 through June 2023, pensions trailed by 1.0 percentage points annually.
A central conclusion of Ennis’s work was that the growing allocation to alternative investments—now averaging nearly 40% of riskier assets in public pension portfolios—has not delivered the expected performance benefits. Instead, Ennis attributes much of the underperformance to high fees, hidden costs, and the illiquidity of these investments, estimating that alternatives dragged down annual returns by about 1% across portfolios with a 28% average allocation to alternatives, and up to 1.5% for those with 40% allocated.
Contrasting Findings
Ennis’ findings significantly contrasted with those of Cliffwater which has maintained a proprietary database of 64 level state pension returns covering fiscal years 2001 to 2024. Cliffwater found that over the same period alternatives contributed 0.63% alpha (risk-adjusted excess return) relative to the benchmark of 70% MSCI ACWI/30% Bloomberg Aggregate Bond Index which returned 5.71% versus the 6.34% return of state pension plans. The chart below from Cliffwater shows that the excess return was present throughout the 24-year period and not isolated to any subperiod.

The Cliffwater database includes returns on individual asset classes which helps identify sources of the 6.34% total return. The chart below shows that the 24-year returns for alternatives private equity and real estate are impressive compared to traditional asset classes.

Private equity and real estate return, weighted by their respective average allocations over 24 years, produced a 9.38% combined return, 2.67% above the 70/30 passive mix. Averaging a combined 14.7% weighting, private equity and real estate contributed an annual 0.54% excess return to overall state pension performance over the 24-year period.
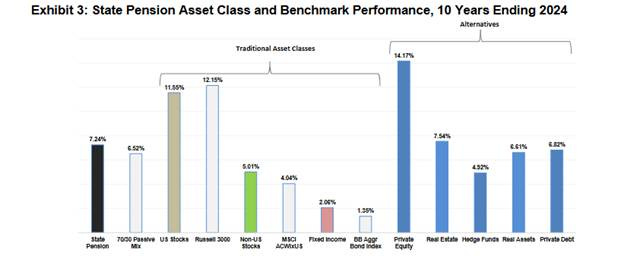
The following chart from Cliffwater reports state pension asset class and benchmark performance covering the last 10 years ending fiscal 2024. Included are additional alternative asset classes, hedge funds, real assets, and private debt, that received more recent allocations. Private equity, real estate, real assets, and private debt are additive to the 70/30 passive mix. Only hedge funds trailed. The alternative asset classes together, weighted by their respective average allocations over 10 years, produced a 9.59% combined annual return, 3.07% above the annual 6.52% return for the 70/30 passive mix. With a combined 30% alternative weighting, the five alternative asset classes together contributed an annual 0.92% excess return to overall state pension performance over the most recent 10-year period.
Explaining the Difference in Reported Results
As noted above, Ennis findings that alternatives detract from performance rely upon regression analysis using returns from a database sponsored by the Center for Retirement Research at Boston College. Cliffwater maintains a similar database. That enabled Cliffwater to roughly replicate Ennis’ findings. Having done so they found that their findings did not differ significantly in the data used or applying the Ennis regression methodology. Cliffwater was also able to identify the source of the difference which led Ennis to conclude that alternatives do not add value when most practitioners believe differently.
The main source of the difference is Ennis’ arbitrary decision to alter reported public pension returns for 2022 and 2023 to address perceived valuation concerns for certain alternative investments (which were not specified). Ennis imposed charges on the 2022 reported return (-10%) and the 2023 reported return (+4%), leaving the 2-year pension return 6% below what was actually reported. Details on these alterations were not provided in the paper. However, given that the alterations were presumably applied to alternative asset classes representing 20% of assets, the implied Ennis overvaluation for these asset classes might approximate 30% at fiscal year-end 2023. The size of the adjustment doesn’t seem appropriate given what we know.
Those responsible for tracking private performance are well aware of the “lag” as private investment managers report valuations one quarter or more after the end of any given performance period, creating a timing mismatch of one to two quarters. Thus, an overvaluation of the magnitude Ennis assumed would have been largely corrected by June 2024. Was it?
Fortunately, Cliffwater’s data includes 2024, which was not covered by Ennis. With that in mind Cliffwater applied the Ennis regression methodology to fiscal years that include 2024 using only reported returns. They found a 0.95% excess return, slightly higher than the 0.63% excess return reported using the pre-2024 data.
Comparison of Ennis and Cliffwater Findings

There is one other source of the difference in Ennis’s results and those of Cliffwater. As noted earlier, in his calculation of risk-adjusted returns, Ennis accounted for the higher beta of private equity relative to the market (1.2 versus 1.0). However, in Cliffwater’s analysis, by regressing the actual PE returns on R3000 and ACWIxUS and lagging them by one year, they determined the PE beta to be 0.98. Thus, therefore there was not much risk-adjustment to make.
Fee Drag on Returns to Private Market Investors; But Competition is Driving Down Fees
Ennis rightly emphasizes that a large hurdle for private investments has been the typical 2%/20% fee structure. In his paper “The Demise of Alternative Investments” Ennis cited Wayne Lim’s study “Accessing Private Markets: What Does It Cost?” which found an estimated fee drag of “5% to 8% in annualized terms.” However, in recent years innovation (such as the creation of evergreen funds: interval and tender offer) and competition have led to investors having access to lower cost vehicles. For example, in January 2017 Blackstone introduced its BREIT product with a 1.25%/12.5% structure, a significant reduction from the typical 2/20. Inception through May 2025 it returned 9.3% while Vanguard’s REIT Index Fund VGSLX returned 4.9%. In addition, BREIT has been much more tax efficient with 96% of its distributions being considered return of capital.
We can also see how lower fees and access to top performing managers has led to the outperformance of the alternative of private credit by examining the returns of Cliffwater’s private credit interval Corporate Lending Fund (CCLFX), with an effective total management fee of 1.58% and no carry. It has outperformed the Bloomberg Aggregate by about 8.7 percentage points per annum (9.6% vs 0.9%) since inception in June 2019. It also has outperformed the Morningstar LSTA Leveraged Loan Index by about 4% percentage points per annum (9.6% vs. 5.6%).
We continue to see competition driving fees lower. For example, Hamilton Lane recently introduced an infrastructure tender offer fund with a management fee of 1.4% with no carry. And the Victory Pioneer ILS Fund provides access to private reinsurance investments, has a management fee of 1.94% and no carry. The days of having to pay 2/20% to access top managers in private markets are gone.
Investor Takeaways
The shift toward alternatives in public pension portfolios has been dramatic: from 14% of riskier assets in 2001 to nearly 40% by 2021. This trend has been driven by a combination of consultant advice, peer influence, and the pursuit of higher returns and diversification. However, the debate over whether these allocations have been justified by net performance continues, with Ennis and Cliffwater representing the two poles of the argument.
As public pension funds continue to grapple with funding challenges and the search for returns, the scrutiny of alternative investments—and the transparency of their reporting—will remain central to the debate. With that said, Cliffwater did show that within their database of 64 state pension plans they found persistent outperformance of private equity and real estate within pension portfolios. This finding is consistent with prior research which has found persistence of performance in private markets. For example, the authors of the 2022 study “Private Debt Fund Returns, Persistence, and Market Conditions,” found “performance persistence across funds managed by the same general partner.” And, in addition to Cliffwater’s own findings, there is additional empirical evidence of persistence of performance in private equity (see here, here, and here).
The key takeaway for investors is that if you are going to allocate to private investments, manager selection is critical and fees matter.
Larry Swedroe is the author or co-author of 18 books on investing, including his latest Enrich Your Future. He is also a consultant to RIAs as an educator on investment strategies.