

A Substack subscriber asked that I write up this paper. Even though it is more than a decade old, it has important timeless lessons.
With the proliferation of powerful computing tools and off-the-shelf backtesting software, building a quantitative investment model has never seemed easier. Yet, as Deutsche Bank’s quantitative strategy team — Yin Luo, Sheng Wang, Miguel Alvarez, Javed Jussa, Allen Wang, and Gaurav Rohal — reminds us in their 2014 paper aptly titled “Seven Sins of Quantitative Investing,” the gap between backtested performance and real-world results is often enormous.
The reason, they argue, comes down to seven common biases that plague even sophisticated practitioners. Here is what they found, and what investors should take away.
What the Authors Examined
The paper is both a cautionary tale and a practical guide. The authors systematically identify and quantify seven biases that distort backtesting results, illustrating each with detailed empirical examples drawn primarily from the Russell 3000 and S&P 500 universes. They then conclude with a tutorial showing how to construct a realistic multi-factor model that avoids all seven pitfalls.
Torture the data hard enough, you can almost always find something that works spectacularly in-sample.
The Seven Sins
1. Survivorship Bias
The most well-known of the seven sins, survivorship bias occurs when backtests use only those companies that remain in business today, excluding firms that went bankrupt, were delisted, or were acquired. The authors demonstrate its destructive power with a striking example: using only the surviving constituents of the Russell 3000 from 1986 completely reverses the apparent efficacy of a credit quality factor. In a properly constructed universe, the highest-quality (lowest credit risk) firms significantly outperform distressed stocks. In a survivor-only universe, the results flip: the worst-quality companies appear to generate returns seven times higher than the best-quality stocks. The intuition: survivor universes effectively let investors “win bets without paying when they lose” — capturing only the positive tail of distressed stocks while ignoring every bankruptcy and delisting along the way.
A closely related variant is current-constituent bias, where practitioners backtest using today’s index members rather than the point-in-time constituents. Using the S&P 500’s current members to backtest a low-volatility factor produces the opposite conclusion from the correct analysis — high-volatility stocks appear to outperform low-volatility stocks by 16 times, completely inverting the well-documented low-volatility anomaly.
2. Look-Ahead Bias
Look-ahead bias arises when a backtest uses information that would not actually have been available at the time of the investment decision. The most common form involves financial statement data. Companies typically require one to two months after a fiscal period ends to file their financials — the average for U.S. companies is 30 days, and for international companies 37 days — yet many backtests assume the data is immediately available. The authors show that assuming instant availability of earnings yield data inflates measured factor performance by nearly 60% relative to results using properly lagged, point-in-time data.
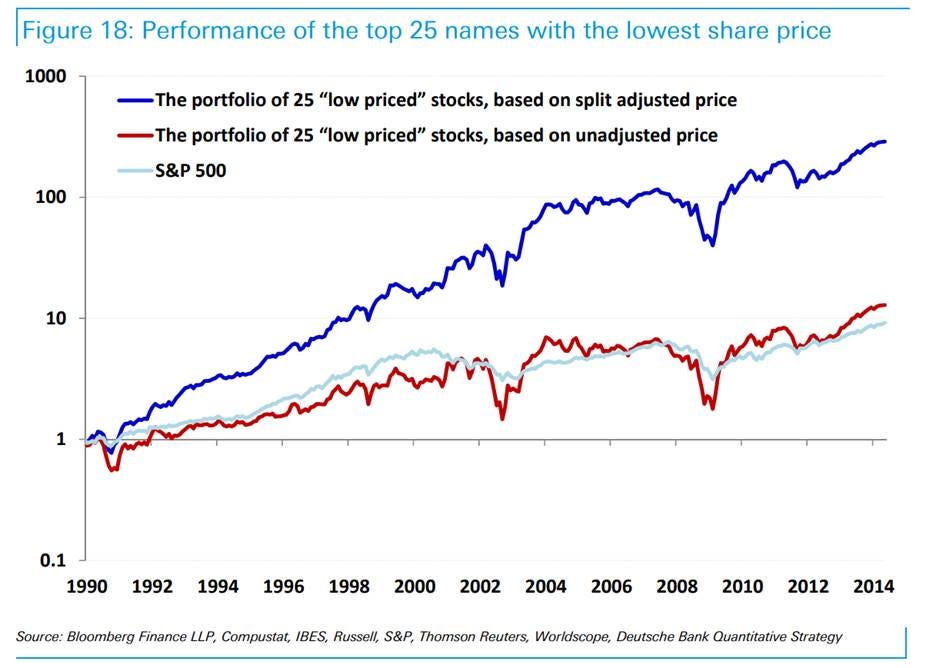
A subtler form involves split-adjusted share prices. When backtesting a “low price” strategy, using split-adjusted historical prices creates severe look-ahead bias: a stock that has undergone multiple splits over 25 years appears to have always had a very low share price, but of course investors couldn’t have known which stocks would split. Using unadjusted prices, the supposed low-price advantage disappears entirely, with those stocks delivering returns roughly equal to the benchmark but at twice the volatility.
3. The Sin of Storytelling
Once analysts identify a pattern in data, they almost invariably construct a plausible economic narrative to explain it. The problem is that a compelling story has no bearing whatsoever on out-of-sample performance. The authors use the value factor in the technology sector as a vivid illustration. A backtest through 1997 showed value working beautifully, supported by two equally convincing stories — a risk premium argument and a behavioral overconfidence argument. Then came the tech bubble, during which value investors in technology stocks lost nearly 70% of their investment. The “new economy” story replaced the old one. Then value recovered sharply after 2000.
The broader problem is publication bias: researchers and practitioners tend to publish only strategies that “work,” flooding the literature with apparent anomalies (leading to what John Cochrane called a zoo of factors) while the failures disappear into file drawers.
4. Data Mining and Data Snooping Bias
Related to storytelling, data snooping involves exhaustively searching through possible factor combinations until finding one that performs well in-sample, then presenting it as a genuine discovery. The authors demonstrate this with a controlled experiment: starting with 72 common stock selection factors, they select the best-performing factor from each of six style categories over a five-year in-sample period. The resulting equally-weighted composite model produces a Sharpe ratio of 0.7 — impressive on the surface. Out of sample, using only information available at each point in time, the model is essentially flat.
Their prescription is to define and adhere to a consistent set of rules for model construction, test those rules across multiple countries and asset classes without parameter tuning, and treat live performance as the only truly credible test.
5. Signal Decay and Turnover
Many factors with strong apparent predictive power decay so rapidly that the transaction costs required to exploit them exceed the alpha they generate. The authors demonstrate this with the short-term reversal factor in Japan: in a frictionless world it produces a 12% annual return, but at 30 basis points per trade the strategy turns negative. Meanwhile the classic value factor (price-to-book) declines only modestly under the same transaction cost assumptions, because its information decays slowly and it therefore requires minimal turnover.
Even when a factor genuinely has predictive power, the relationship between turnover constraints and performance is not linear. For the authors’ proprietary N-LASR machine learning model — which relies on rapidly decaying signals — tightening turnover from 120% to 40% per month cuts the Sharpe ratio by nearly a third.
Perhaps counterintuitively, the authors also show that frequent rebalancing dominates annual rebalancing even when total annual turnover is held constant. A monthly-rebalancing value portfolio constrained to 36% annual turnover beat an annually-rebalanced portfolio with identical turnover by 1.5 times over 26 years, because incorporating new information continuously is more valuable than concentrating all portfolio changes on a single calendar date.
6. Outliers: Spectacular Successes and Failures
Outliers in financial data are ubiquitous and consequential. The authors examine several techniques for handling them — winsorization (replacing extreme values with a threshold value), inter-quartile range truncation, z-score normalization, and ranking normalization — and reach nuanced conclusions.
Their preferred general approach is ranking normalization, which automatically converts any distribution into a uniform one, effectively neutralizing outliers without discarding them. Applied across 25 countries in the MSCI ACWI, ranking normalization outperforms z-score normalization in most markets and generates higher signal serial correlation (implying lower turnover) as a bonus.
However, they caution that outliers are not always noise. For price momentum, the magnitude of the signal — not merely its rank — contains useful information. A signal-weighted portfolio using raw momentum scores outperformed the ranking-normalized version by 205% over 20 years, because the distance between momentum scores embeds information about market direction that ranking discards.
7. The Asymmetric Payoff Pattern and Shorting Cost
The final sin involves the common assumption that a factor’s performance on the long side mirrors its performance on the short side. In practice, the payoff pattern is frequently highly asymmetric, and this asymmetry has major implications for long-only versus long/short investors.
Value factors — earnings yield, EBITDA-to-EV, free cash flow yield — generate most of their alpha from the long side. An investor who can capture the value premium without shorting loses relatively little. Momentum and quality factors, by contrast, generate a disproportionate share of their alpha from the short side, making them far more dependent on the ability to short efficiently.
This matters enormously because shorting is neither free nor always available. Using securities lending data, the authors find that the stocks most attractively ranked for shorting by many factors — those most likely to be in a short portfolio — are also the most expensive to borrow, with hard-to-borrow names concentrated precisely where the short alpha is greatest. Restricting the N-LASR model’s short book to easy-to-borrow stocks cuts cumulative performance nearly in half relative to an unconstrained backtest. Theoretical backtesting that ignores short availability inflates the Sharpe ratio by 48%.
Interestingly, once short availability constraints are imposed realistically, diversification clearly dominates concentration. A portfolio of 800 names (400 long/400 short) improves the realistic Sharpe ratio by roughly 50% relative to a concentrated 50-name portfolio, because the hard-to-borrow problem is more acute in concentrated books targeting the most extreme short candidates.
The Takeaways