
The Sky Isn’t Falling
New Data Pushes Back on Private Credit Doom and Gloom

There’s been no shortage of alarming headlines about private credit lately. Rising defaults, deteriorating loan quality, public Business Development Companies (BDCs) trading at steep discounts—the narrative has grown increasingly pessimistic. But a new research note from Cliffwater LLC provides hard data that shows the sky isn’t falling. Here’s what they examined, what they found, and why it matters.
What Did Cliffwater Examine?
Cliffwater’s research centers on the CDLI, the most comprehensive benchmarks for private credit performance as it tracks the performance of more than 20,000 US middle market loan holdings and assets of more than $500 billion. The CDLI aggregates the underlying loan data from all Business Development Companies (BDCs)—both publicly traded and unlisted—pulling directly from SEC filings to give investors a transparent window into a market that is otherwise notoriously opaque.
The February 2026 report, which includes data from all the BDCs that had filed their return information, focused on three core questions:
How did private debt perform in 2025, and how does that compare to other credit asset classes?
Are credit losses and loan quality deteriorating in line with the risk narrative that has dominated the press?
What should investors make of the current discount at which public BDC stocks are trading relative to their underlying net asset values?
Key Findings
Performance Was Solid—and Consistent
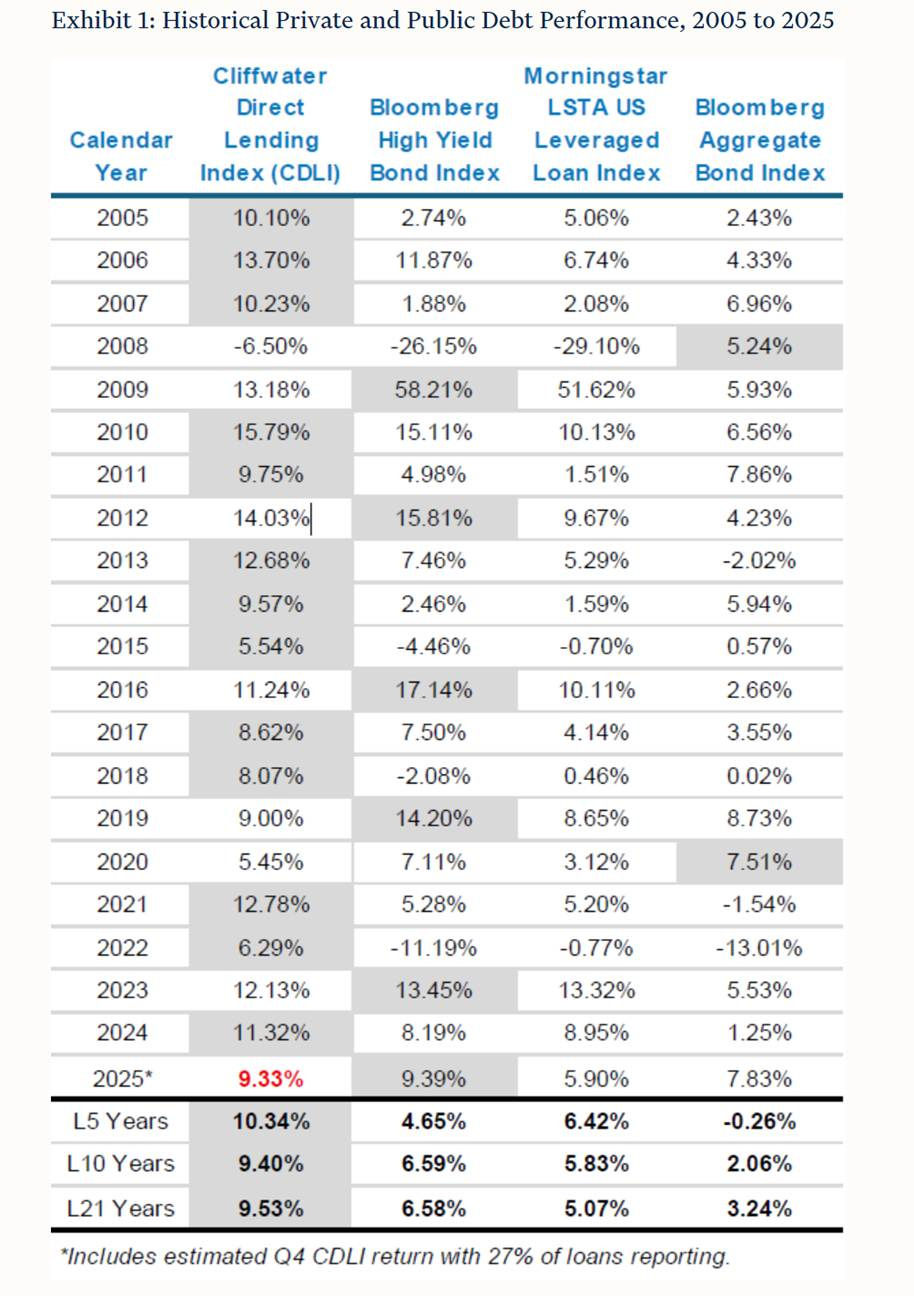
Private debt returned an estimated 9.33% for the full calendar year 2025 and 2.22% in Q4 2025—a strong result, particularly when the asset class delivered it with floating-rate exposure in a declining interest rate environment—a headwind that hurt broadly syndicated loans relative to fixed-rate instruments.
For context, high yield bonds returned 9.39% and the Bloomberg U.S. Aggregate Bond Index returned 7.83% in 2025, both benefiting from falling rates that boosted fixed-coupon bond prices. That private debt essentially matched high yield—without the benefit of duration (because private debt has floating rates, it doesn’t get the price boost that fixed-rate bonds receive when interest rates fall) —underscores the consistency of its income-driven return profile.
Over longer time horizons, the CDLI’s edge is even clearer. Private debt outperformed the Morningstar LSTA US Leveraged Loan Index by an estimated 3.43% in 2025, roughly in line with its 10-year annualized advantage of 3.57%.
The Default Fears Haven’t Materialized
Perhaps the most striking finding was that realized credit losses for Q4 2025 were just 0.13%, and 0.70% for the full calendar year—below the historical annual average loss rate of 1.01% for private debt. Cliffwater’s research has shown that credit losses are closely tied to recessions, and with no recession currently in sight (unfortunately, all economic crystal balls are cloudy)—the current forecast of the Federal Reserve Bank of Atlanta for Q:1 2026 growth in GDP is 3.1%—there is no reason to expect a sudden deterioration.
Non-accrual loans—a key measure of loan health—ticked up modestly to 1.48% of cost value from 1.33% the prior quarter but remained below their long-run average of 2.13%.
Yields Remain Attractive
Despite falling somewhat from their peaks, CDLI income yields are estimated at 9.94% annualized as of year-end, compared to 6.99% for broadly syndicated loans—a nearly 3% yield premium (reflecting an illiquidity premium). With credit spreads and SOFR having stabilized, this yield level looks to be sustainable going forward.
BDC Discounts Are a False Alarm—Historically Speaking
Perhaps the most contrarian argument in the report addresses the narrative that deep discounts in publicly traded BDC share prices signal trouble ahead for private debt.
Cliffwater looked back at five periods since the 2008 financial crisis when BDC public market prices fell to significant discounts relative to their net asset values (NAVs):
Event
BDC NAV Discount (%)
Next 1-Year Private Debt Return (%)
Euro Crisis (9/2011)
-17%
+14.20%
Oil Crisis (12/2015)
-21%
+11.23%
COVID (3/2020)
-50%
+14.41%
Inflation/Rate Hike (6/2022)
-17%
+9.69%
Today (2/2026)
-16%
?
In every prior case, the steep BDC discount was followed by strong returns in the underlying private debt market. The average discount across the first four episodes was -26%, with average subsequent one-year returns of +12.38%. Today’s -16% discount is shallower than most of those historical stress points. While past performance doesn’t guarantee future results, the conclusion should be that public equity market pricing for BDC stocks is a poor predictor of private debt returns.
Key Takeaways for Investors
The narrative and the data tell different stories. The press coverage surrounding private credit defaults and BDC discounts has created an impression of an asset class under siege. The actual performance data, and the historical precedent, suggest something more mundane: a healthy asset class with modest credit noise trading in line with long-run expectations. And perhaps the BDC discount is a contrarian signal.
Income remains the story. With current yields near 10% and spreads stabilized, private debt continues to offer a compelling income advantage over public credit alternatives. The 2025 return of 9.33% was primarily driven by income, not price appreciation—the return profile the asset class is designed to deliver.
Loan quality bears watching, but not panicking over. Non-accruals did tick up slightly in Q4. However, current metrics remain below historical averages, and the macro backdrop is the key variable that would need to change materially to shift the credit loss picture.
Public BDC discounts are a distraction. For investors in private debt funds or direct lending vehicles, the public market’s pricing of BDC shares is largely irrelevant to the return they’ll earn—history suggests those discounts often represent buying opportunities rather than warning signals.
Diversification remains the bottom line. Private debt deserves a place in a diversified portfolio. Its return pattern—consistent, income-driven, with returns fluctuating in a relatively modest band—is a genuine portfolio diversifier, and the current environment, despite the noise, doesn’t change that fundamental case for investors able to set aside a portion of their portfolio in less liquid assets.
Larry Swedroe is the author or co-author of 18 books on investing, including his latest Enrich Your Future. He is also a consultant to RIAs as an educator on investment strategies.
And it might also have a lower than projected impact! As always my crystal ball remains cloudy. Remember diversification is your friend
I own both, CCLFX is senior, secured and sponsored by private equity firms, while CELFX is a much broader fund investing in other sectors of PC with in some cases little to no correlation to economic cycle risk, such as drug royalties, litigation finance, asset backed lined like accounts receivable. Has yield about 1-1.5% more than CCLFX and because it is more diversified it may not have more risk when viewed in portfolio context. Thus I own roughly equal amounts of both. I also own FRBBX which invest in BBs of CLOs, by Flat Rock.