
The Value Bridge Problem
Why Private Equity’s Favorite Performance Metric Doesn’t Hold Up

In his June 8, 2026 Substack column, Oxford finance professor Ludovic Phalippou, known for his long-running critique of IRR as a private equity performance measure, turned his attention to a different but related tool: the “value bridge” — a chart found in virtually every PE pitch deck that decomposes a deal’s return into the contributions of EBITDA growth, multiple expansion, and leverage. His argument is that this decomposition isn’t just imprecise. It’s structurally broken. And despite being demonstrably wrong, it’s being taught at the world’s top business schools without being seriously challenged
What He Examined
Phalippou examined a France Invest/E&Y report on French buyout exits from 2019 to 2024, which concluded that value creation in those deals came 77% from EBITDA growth, 36% from multiple expansion, and -13% from debt. He noted that the same framework shows up in MBA classrooms at Wharton and Harvard, where it’s presented as a legitimate analytical tool rather than a marketing artifact. His broader claim is that no PE academic he’s aware of has ever pushed back on a value bridge presentation, even though the underlying logic falls apart under modest scrutiny.
Key Findings
Phalippou’s first point is comically simple: If leverage really destroyed 13% of value, the obvious fix would be to stop using leverage. Yet PE firms never do, and no one in the industry brags about eliminating debt to boost returns. That contradiction is the tell.
To show why, he walks through a basic example. A company bought unlevered for 100 in enterprise value, with EBITDA doubling and the multiple expanding over five years, produces a value bridge that splits credit evenly between EBITDA growth and multiple expansion. Once the same deal is restructured with leverage, the bridge starts assigning a negative contribution to debt, on the order of -13% to -14%, while EBITDA growth’s share balloons.
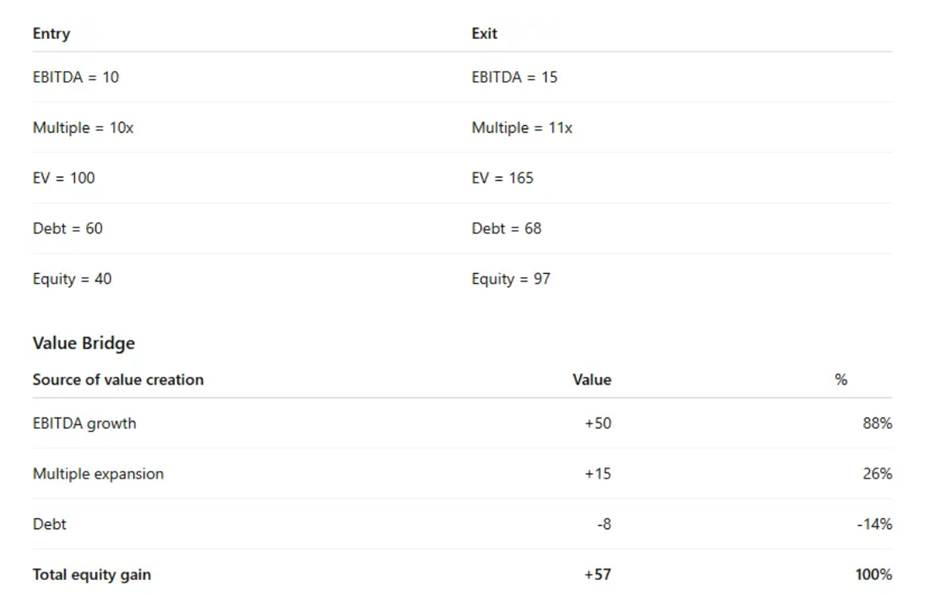
However, the investor outcome moves in the opposite direction. In Phalippou’s example, the unlevered investor puts up 100 and gets back 165, an annualized return of roughly 13.4%. The levered investor puts up only 40 and gets back 97, an annualized return of about 24.7%. Leverage nearly doubled the equity holder’s return, while the value bridge insists it subtracted from value. The bridge is built on enterprise-value decomposition. But that is clearly not the correct lens through which an equity investor’s actual return should be measured.
The second flaw he identifies is that value bridges don’t distinguish organic earnings growth from earnings bought through acquisitions. If a GP raises additional equity and debt to acquire another company’s EBITDA, the bridge still classifies that under “EBITDA growth,” crediting it as if management had grown the existing business. Phalippou’s illustration takes this to the extreme: a deal with zero organic earnings growth, where all the EBITDA increase comes from an acquisition, still shows up in the bridge as if 88% of value creation came from operational improvement. France Invest and E&Y did attempt to separate organic from inorganic growth, which he credits them for, but the split is generated by interviewing deal teams rather than through any independent decomposition. Given that GPs have every incentive to describe their growth as organic, he treats that figure with substantial skepticism.
Investor Takeaways
Keep reading with a 7-day free trial
Subscribe to Larry’s Substack to keep reading this post and get 7 days of free access to the full post archives.