

Default rates get cited constantly in discussions of private credit risk, but the metric is less useful than it appears. The reason is definitional inconsistency: what one manager classifies as a default — a missed payment — another manager may exclude entirely if a loan undergoes a “consensual restructuring” or a partial exchange that nonetheless impairs the lender’s recovery. When the underlying definition shifts from manager to manager, the resulting statistic tells you very little about comparative risk.
Two recent papers from Aksia (published in partnership with Calamos as part of the AC Private Markets platform) take a different approach. Rather than relying on default rates, the authors — Chris Schelling and Jim Vos — go directly to the metric that should matter to investors: permanent loss of capital. Using a database of more than 60,000 individual private credit transactions, roughly 40,000 of which have been fully realized between 2013 and 2025, they decompose realized credit risk into its two constituent parts and then layer on a forward-looking view of current credit conditions. Let’s examine both what they found and where the analysis has limits.
Decomposing Loss Into Frequency and Severity
The first paper’s central methodological contribution is separating loss frequency (the percentage of realized deals that returned less than invested capital) from loss severity, or its inverse, the recovery rate (the percentage of capital recovered on those loans that did lose money). Multiplying the two together produces the loss ratio — the actual dollar-weighted percentage of capital lost, which is the number that matters for portfolio returns.
This decomposition matters because frequency and severity can offset each other. For example, a 4% loss frequency with 75% recovery and a 2% loss frequency with 50% recovery produce an identical 1.0% loss ratio despite looking quite different on the surface.
Applied to the full dataset, the results are notably benign. Direct lending — the largest and most institutionally relevant segment of the private credit market — shows a cumulative loss frequency of just 4.3% across all deals (3.6% for first-lien only) and a cumulative loss ratio of 1.1% (0.8% first lien only) over the 2013–2025 sample. The 1.1% loss rate is slightly higher than that of Cliffwater’s CDLI rate of 1.0% over the period September 2004-March 2026.
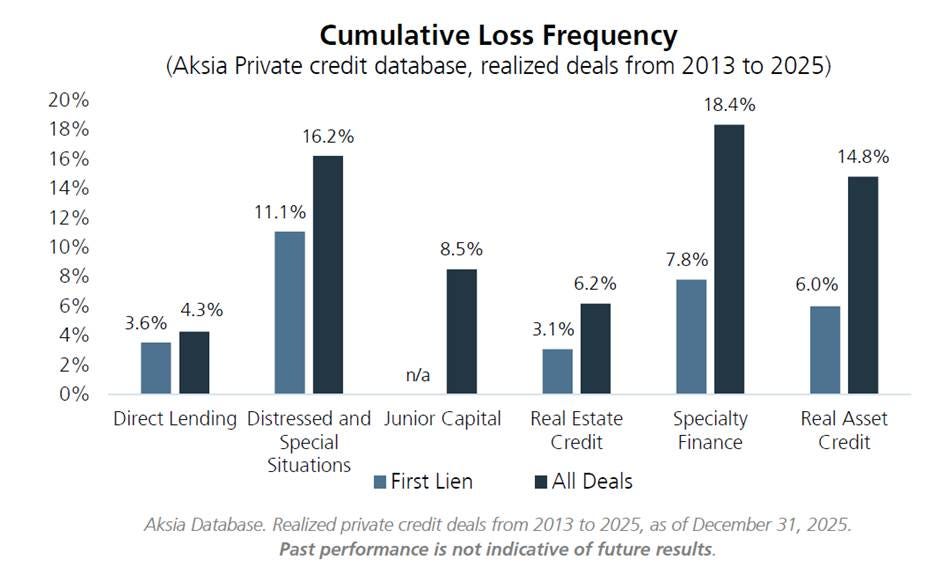
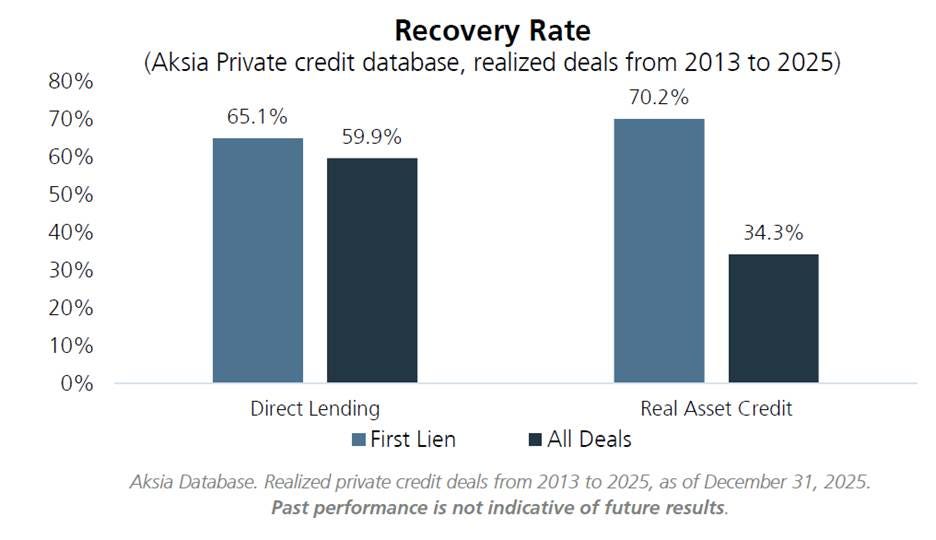
Distressed and special situations credit, junior capital, and the smaller real assets/specialty finance sleeves show meaningfully higher loss frequencies and ratios, which is unsurprising given the nature of those strategies, though sample sizes shrink considerably outside direct lending and distressed.
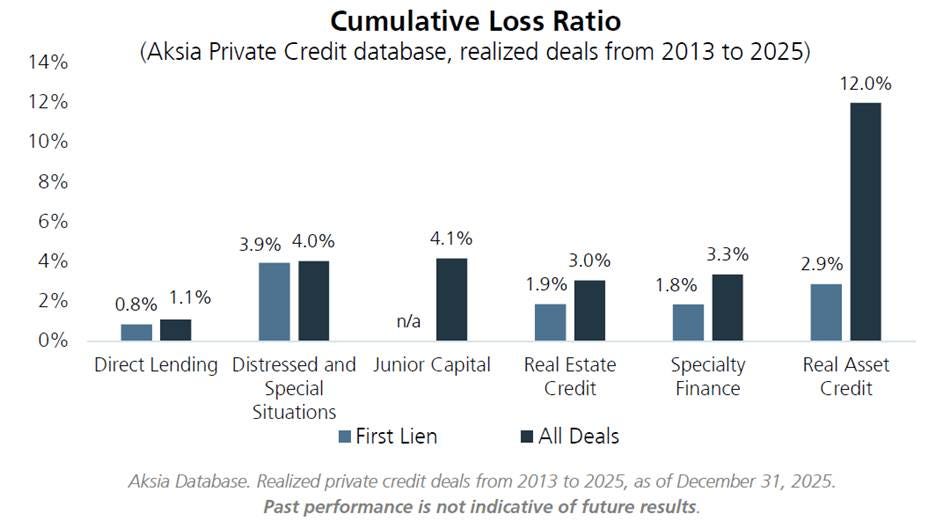
It’s worth flagging an important caveat the authors themselves raise: these are cumulative, not annualized, loss figures. Since direct lending averages about four years until the loans are paid off, a 1.1% cumulative loss ratio means annualized principal impairment is closer to 20–30 basis points.
The Industry Breakdown Confirms Intuition, With a Useful Twist
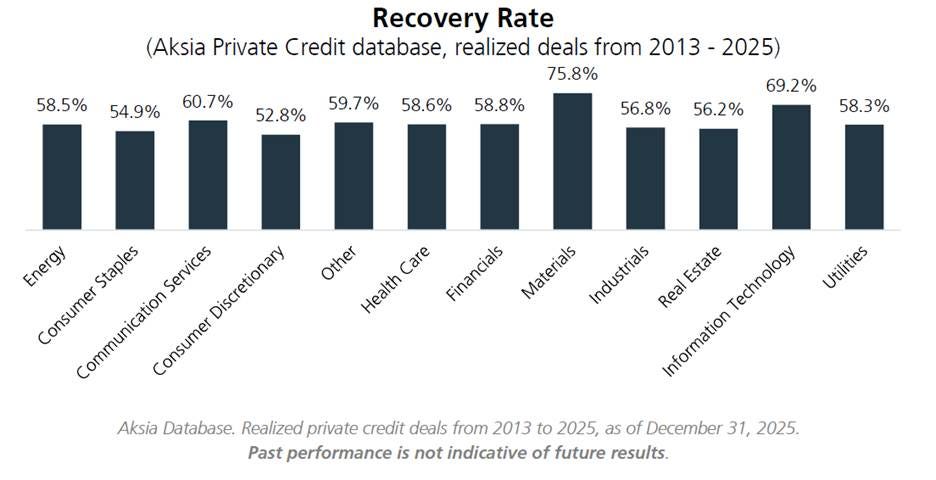
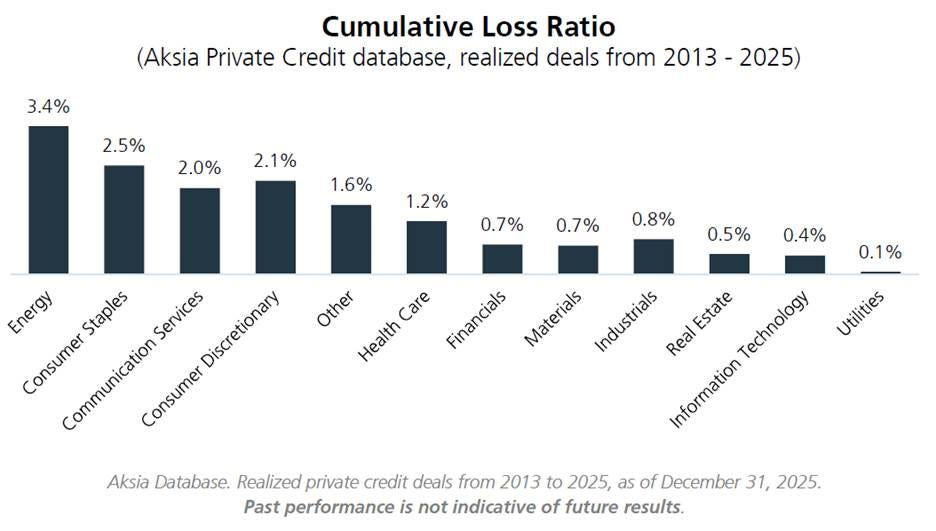
Sorting the direct lending sample by borrower industry produces results that largely confirm prior expectations — energy and consumer-discretionary sectors show the highest loss frequencies (7.8% and 6.8%, respectively) and loss ratios, while IT, utilities, and materials sit at the low end, with loss ratios under 0.5%. None of this should surprise anyone familiar with credit cyclicality.
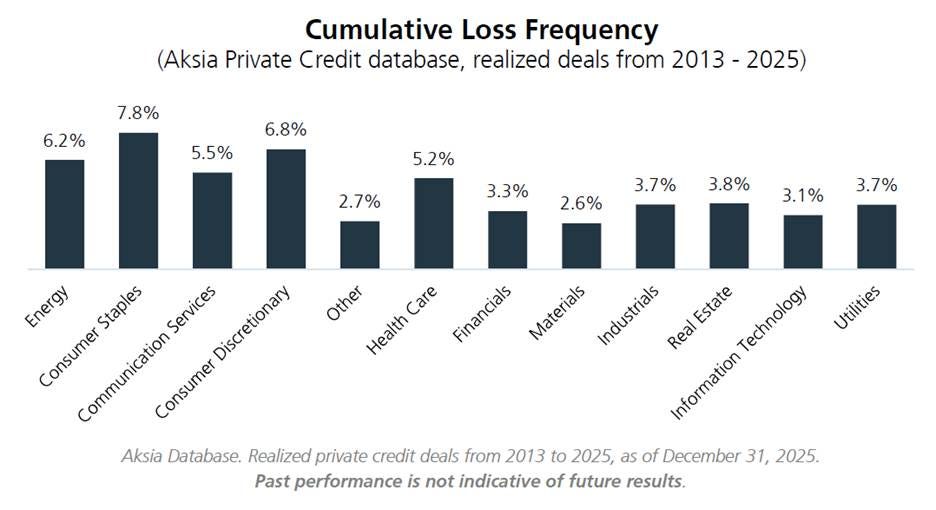
The more interesting finding is recovery rates cluster fairly tightly across most sectors in the 55–60% range, but consumer sectors combine both higher loss frequency and below-average recoveries — a double-barreled risk that compounds rather than offsets. This is the kind of detail that a simple default-rate comparison would never surface, and it’s exactly the value-add of the frequency/severity framework.
The Scenario Analysis: Useful Framing, With One Important Asterisk
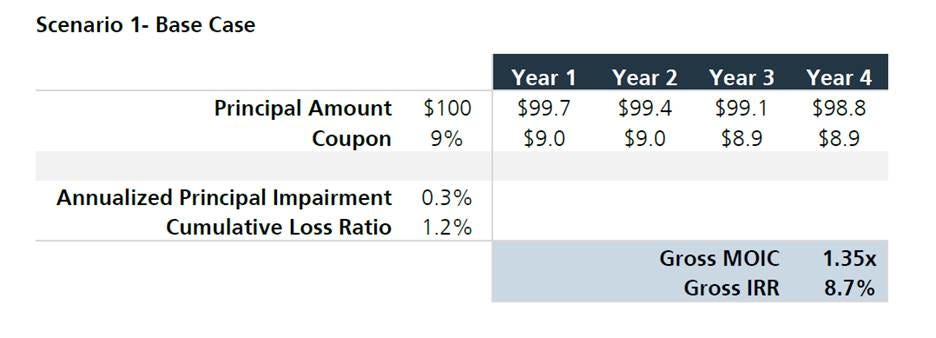
The first paper’s most useful contribution for investors is its scenario analysis, which translates loss ratios directly into return outcomes. Starting from a 9% gross coupon and a four-year hold, the authors show that the historical base-case loss ratio (1.2%) reduces gross IRR by only about 30 basis points relative to a zero-loss scenario (8.7% versus 9.0%).
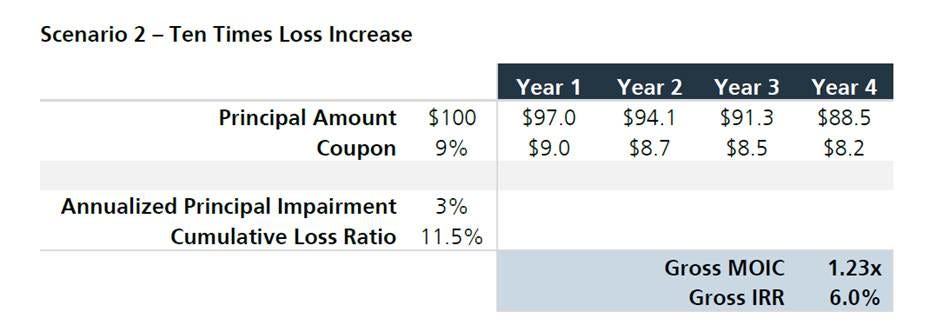
Even a scenario with annualized principal impairment 10 times higher than the historical average — an extreme assumption — still produces a positive 6.0% gross IRR.
To get to a zero-return outcome requires a cumulative loss ratio of 31.4%, which the authors note is dramatically higher than anything observed even in the riskiest historical sectors and industries.
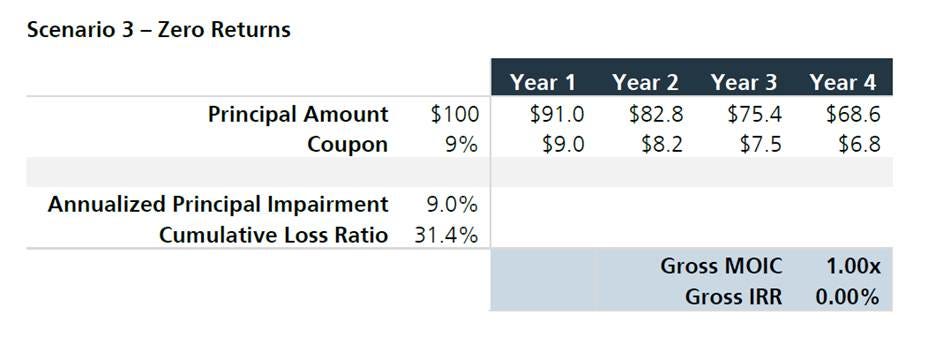
This is a useful exercise for investors trying to sanity-check the credit-apocalypse narratives that have circulated in financial media. But it’s worth being explicit about what the scenario analysis is and isn’t doing. It holds yield and recovery dynamics constant and varies only the principal-impairment assumption — it doesn’t model correlated stress scenarios where rising defaults coincide with widening spreads, slower realizations, and NAV markdowns simultaneously, which is the more realistic shape of an actual credit cycle downturn. The authors are appropriately humble about this, conceding that “loss ratios have been relatively low and muted in recent periods” and that they “fully expect both loss frequency and loss severity will increase from here.” That’s a more honest framing than the headline numbers alone would suggest, and investors should weigh the scenario analysis accordingly — as a useful floor-setting exercise, not a forecast.
Vintage Effects and the Backward-Looking Problem
The second paper addresses the most obvious objection to the first: loss frequency and loss ratio are inherently backward-looking and cumulative, meaning younger vintages will mechanically show lower losses simply because they haven’t had time to realize their problem credits yet. Sorting the same direct lending dataset by vintage year confirms this directly — 2014 vintage loans show a 5.9% loss frequency versus just 1.9% for the 2023 vintage — a pattern that’s an artifact of maturation and exit timing as much as a reflection of differing credit quality across years.
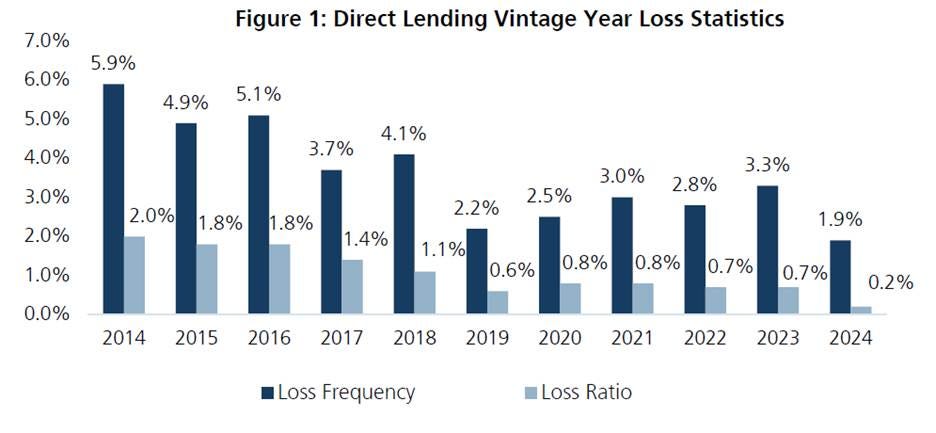
This is the right way to read vintage comparisons, and the authors are clear that the relevant signal is cyclicality, not a claim that the market is somehow “less risky” now than a decade ago. The data does show 2021–2023 vintages bearing the brunt of the Fed’s rate-hiking cycle, consistent with rising base rates increasing debt-service burdens on floating-rate borrowers across the board.
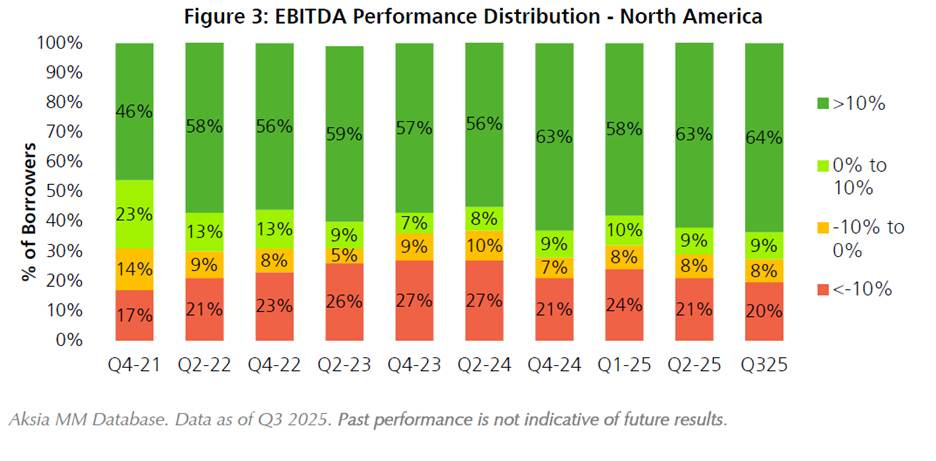
To get a present-tense read on credit health, the authors turn to two forward-looking metrics tracked quarterly across roughly 15,000 active credits: EBITDA growth and interest coverage ratios. Both show genuine improvement.
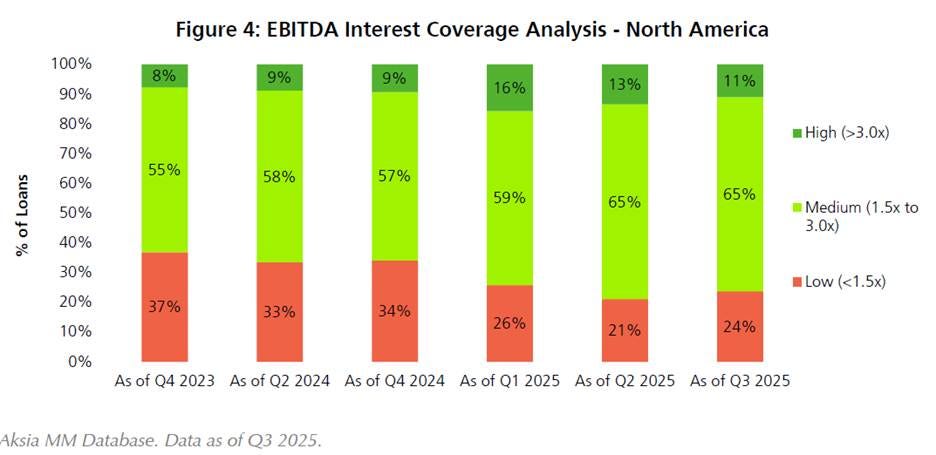
The share of borrowers in the lowest interest-coverage bucket (under 1.5x) fell from 37% in Q4 2023 to 24% by Q3 2025, while the medium-and-high coverage buckets correspondingly grew — tracking the moderation in both base rates and direct lending spreads that occurred over that period. Roughly three-quarters of borrowers have grown EBITDA since loan issuance, with about two-thirds of those showing double-digit growth.
After reviewing their two papers, I asked the researchers if they could breakdown the loss frequency and the loss ratios for direct loans that are backed by private equity sponsors versus non-sponsored loans. Not surprisingly the data showed that loans backed by private equity sponsors not only had a much lower frequency of default (2.9% versus 5.0%), but also a much lower actual loss ratio (1.3% versus 2.0%). This was even though the recovery rates were slightly higher (60%) for the non-sponsored loans than for the sponsored loans (55%). The researchers cautioned that since the vast majority of direct loans are sponsored by private equity, the sample size for the non-sponsored loans was relatively small. Thus, they would hesitate to draw a conclusion on the recovery rate difference.
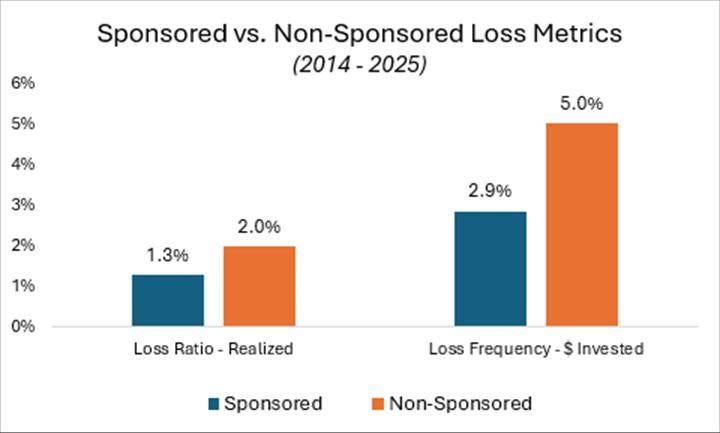
Aksia MM Database. Data as of Q3 2025. Past Performance is not indicative of future results.
Investor Takeaways
A few conclusions seem warranted, with appropriate caveats: